

Average Length of Rental for Repairable Vehicles: Q1 2021
The quarterly LOR summary is produced by Enterprise Rent-A-Car. Through its ARMS® Automotive Suite of Products, Enterprise provides collision repair facilities with free cycle time reporting with market comparisons, free text/email capability to update their customers on vehicle repair status, and online reservations. More information is available at armsautosuite.com.
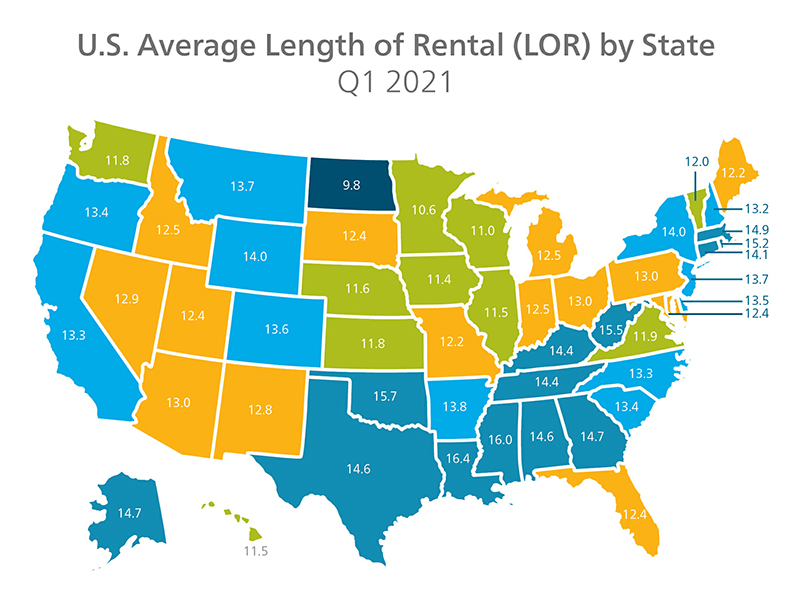
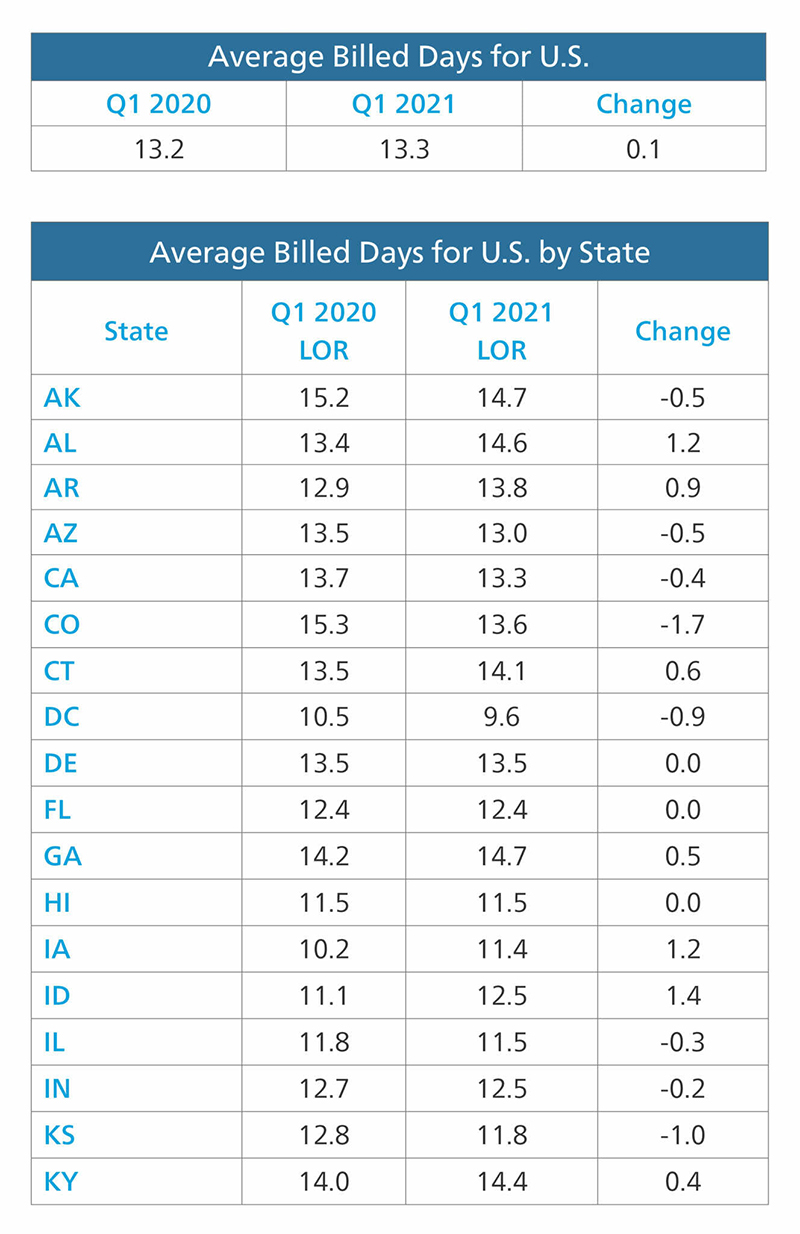
U.S. Length of Rental—Q1 2021
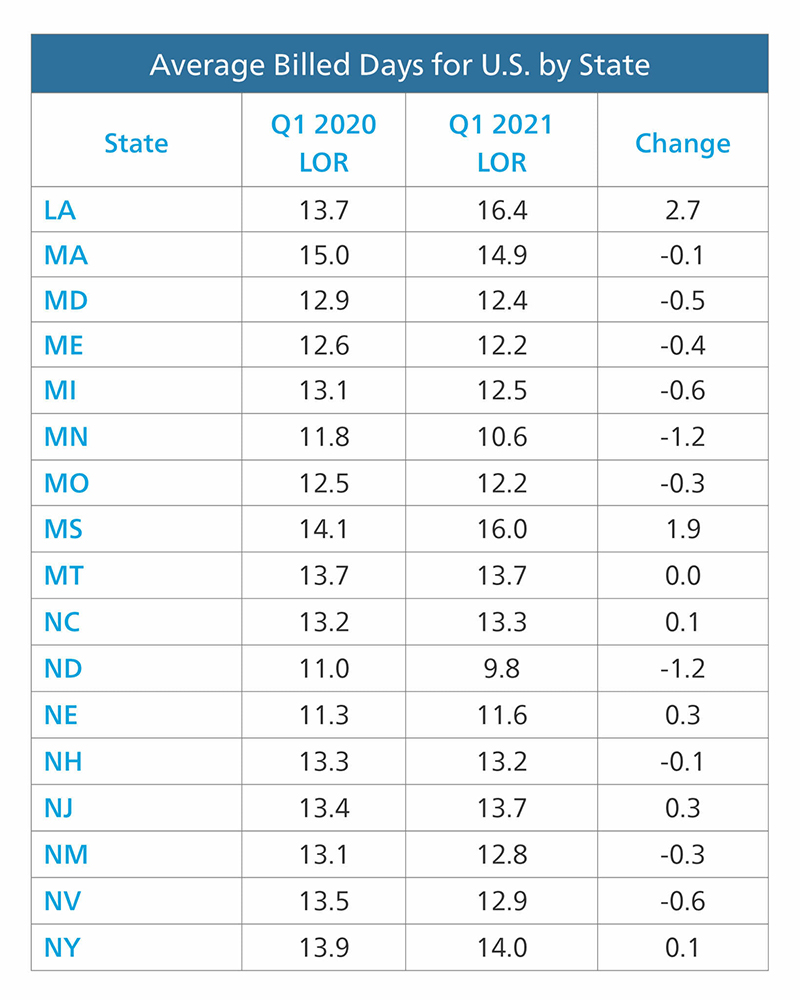
Overall U.S. LOR for Q1 2021 remained stable compared to Q1 2020, with an increase of only 0.1 days. Since COVID’s impact on 2020 LOR was most evident in April’s increases, we may see a larger difference when analyzing LOR next quarter. Drivable claims were mixed across the board, averaging out to match the overall YOY increase of only 0.1 days compared to Q1 2020. Meanwhile, Non-Drivable claims dropped 1.1 days (18.9 in Q1 2021 vs. 20.0 in Q1 2020). Rentals with Total Loss claims rose 0.3 days from 14.0 to 14.3 days. Significant increases across all categories were seen in AR, LA and MS—states that were hit hard by winter storms in Q1 while still recovering from storms during the summer of 2020.
Drivable
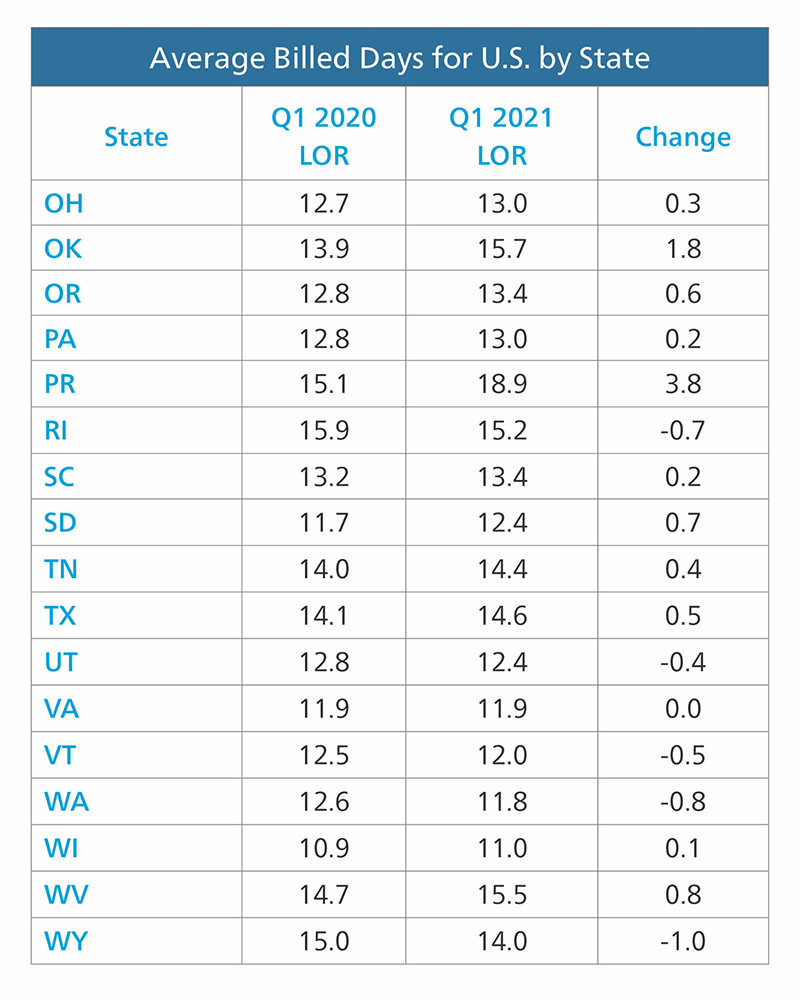
Louisiana saw the largest Drivable increase of 2.7 days. States that saw increases of a full day or more include AL, IA, ID, MS, OK and SD. Colorado had the largest decrease, dropping 1.8 days from 2020 (13.3 to 11.5). This drop was almost a full day greater than the next nearest state, Minnesota, which dropped 1 full day from 10.4 to 9.4.
Non-Drivable
Louisiana also had the largest increase in Non-Drivable claims, rising 2 full days (from 20.4 to 22.4). Three other states saw a Non-Drive increase of greater than a day (ID, MS, and OK). Only five other states had any increase at all (AK, AL, AR, IA, VT). Forty-one states, plus DC, saw Non-Drive decreases—many significant. Wyoming saw the largest decrease of -4.6 days. Colorado, Kansas, Minnesota, North Dakota and Washington all had decreases of 3 days or greater, while a further five states (CA, HI, MD, NH, NV), plus DC, saw decreases between 2.0 and 2.9 days. Seventeen additional states saw decreases greater than 1 day.
Total Losses
Louisiana also led the country in Total Loss increase—up 2.6 days (from 13.6 in Q1 2020 to 16.2 in Q1 2021). AR and OK both saw Total Loss increases of 2 days, and eight other states were up by at least a day. Rhode Island saw the largest decrease at -2.6 days, followed closely by DC at -2.1 days. Four other states saw a decrease of a day or greater (DE, MD, NJ, WY), with various decreases seen across 11 other states. We asked PartsTrader’s Chief Innovation Officer Greg Horn about recent industry buzz around potential parts shortages or delays affecting collision repair in the US, as well as his outlook on the future. Horn responded: “We’ve heard those concerns as well and looked into our U.S. marketplace data. With over $100 million in monthly parts sales, PartsTrader looks at two key metrics to assess supply chain health: delivery time averages and the number of quotes per part. Average delivery time quoted was 2.1 days, which was an increase of only 0.1 days from Q1 2020—identical to the increase Enterprise saw in overall LOR. However, the number of quotes per part for Q1 2021, which would point to any parts backorders, was 8.2 quotes per part, slightly more than Q1 2020, indicating a robust part supply. While the widely reported microchip shortage has had a major impact on new vehicle production, the impact has been minimal on collision repair. That said, an upcoming shortage of raw natural rubber products—mainly the product of a rubber plant leaf disease—may start to impact OE production with a shortage or price increase on tires, hoses and belts.”
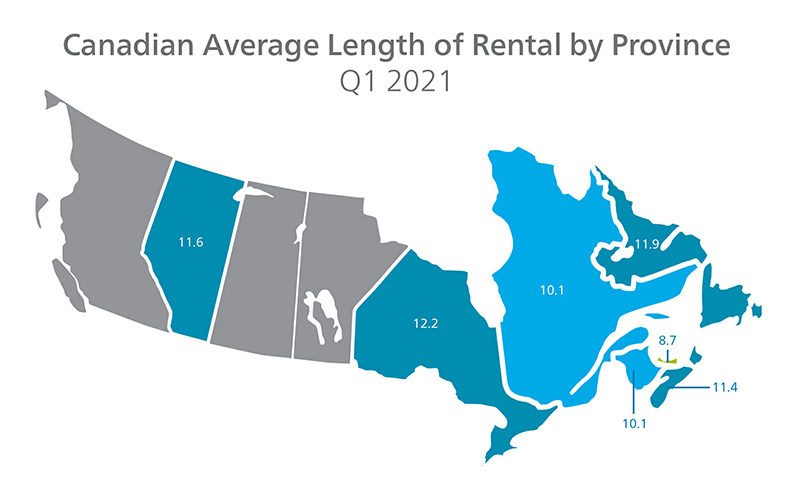
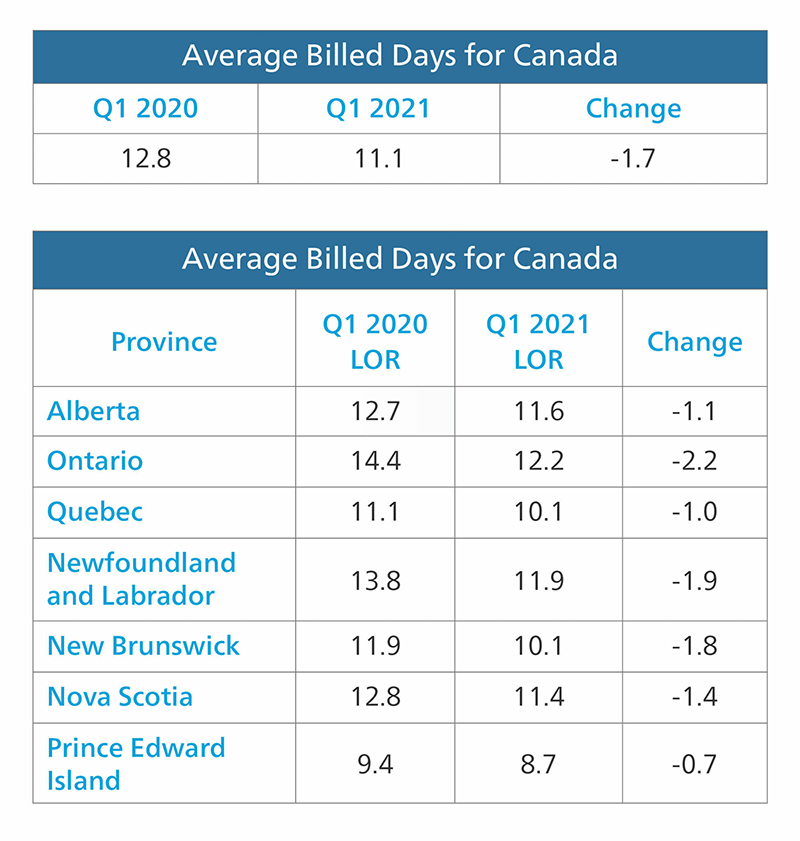
Canada Length of Rental—Q1 2021
During the 1st quarter of 2021, Canada saw a significant drop in overall LOR, down 1.7 days from Q1 2020. COVID-related lockdowns and decreased traffic have had a significant impact on repairable claims. The drop in repairable claims has given shops more capacity to turn repairs more quickly. Ontario experienced the largest drop in LOR at -2.2. days, followed by NL, NB and NS. While Alberta’s decrease is not as pronounced, potentially due to residual repairs from summer storms, AB still dropped more than a full day (-1.1). Drivable LOR dropped 1.4 days from Q1 2020 across all provinces. Non-Drivable LOR was down 2.2 days countrywide, with Ontario seeing the greatest drop of almost 3 full days (-2.7). Meanwhile, Total Losses were down only 0.6 days.
“Repairable claims volume was down significantly in January and February over the same time period in 2020 (33% in Jan ’21 and 24% in Feb ’21) leading to the ability to complete repairs in a timelier manner. The percentage of Non-Drivable repairs in Canada also fell slightly from 23.62% in Q1 2020 to 23.55% in Q1 2021.”
Drivable
All provinces saw a decrease in Drivable LOR with Ontario dropping the most from Q1 2020 (-2.2 days) and Quebec showing the slightest at -0.3 days.
Non-Drivable
Incredibly, all provinces dropped in Non-Drivable claims as well, though results were more pronounced than with drivable repairs. Ontario once again led the provinces with a drop of 2.7 days. Quebec also recorded the lowest decrease with LOR dropping "only" 1.1 days. This information is supported by Ryan Mandell, director of performance consulting at Mitchell International: “Repairable claims volume was down significantly in January and February over the same time period in 2020 (33% in Jan ’21 and 24% in Feb ’21) leading to the ability to complete repairs in a timelier manner. The percentage of Non-Drivable repairs in Canada also fell slightly from 23.62% in Q1 2020 to 23.55% in Q1 2021.”
Total Loss
“While overall Total Loss frequency increased from 20.6% in Q1 2020 to 21.5% in Q1 2021, zero-to-three-year-old vehicles saw the largest increase of any age group, especially in Ontario,” Mandell continued. “Newer vehicles may have less available comps in the marketplace that closely match the options of the loss vehicle, thereby creating a situation where settlement may be delayed as more negotiation between carrier and customer may be required. The LOR increase in Ontario is likely explained by the increase in Total Loss volume in the province. Q1 2021 saw a 25.3% Total Loss ratio, which is the highest of any quarter over the past 5 years. The additional volume would impact carriers’ ability to process all the Total Loss claims through to closing with the same efficiency.”
While Q1 2021 seems stable at a macro level in the US and Canada has experienced significant decreases, Q2 of 2021’s results will be interesting on several fronts. How will the impact of ongoing shutdowns compare to the immediate impacts that COVID and shutdowns brought in Q2 2020? We’ll be monitoring the overall percentages of Drivable, Non-Drivable and Total Loss claims, while analyzing any supply chain impacts on vehicles or parts.