

Average Length of Rental for Repairable Vehicles: Q1 2023
The quarterly LOR summary is produced by Enterprise Rent-A-Car. Through its ARMS® Automotive Suite of Products, Enterprise provides collision repair facilities with free cycle time reporting with market comparisons, free text/email capability to update their customers on vehicle repair status, and online reservations. More information is available at armsautosuite.com.
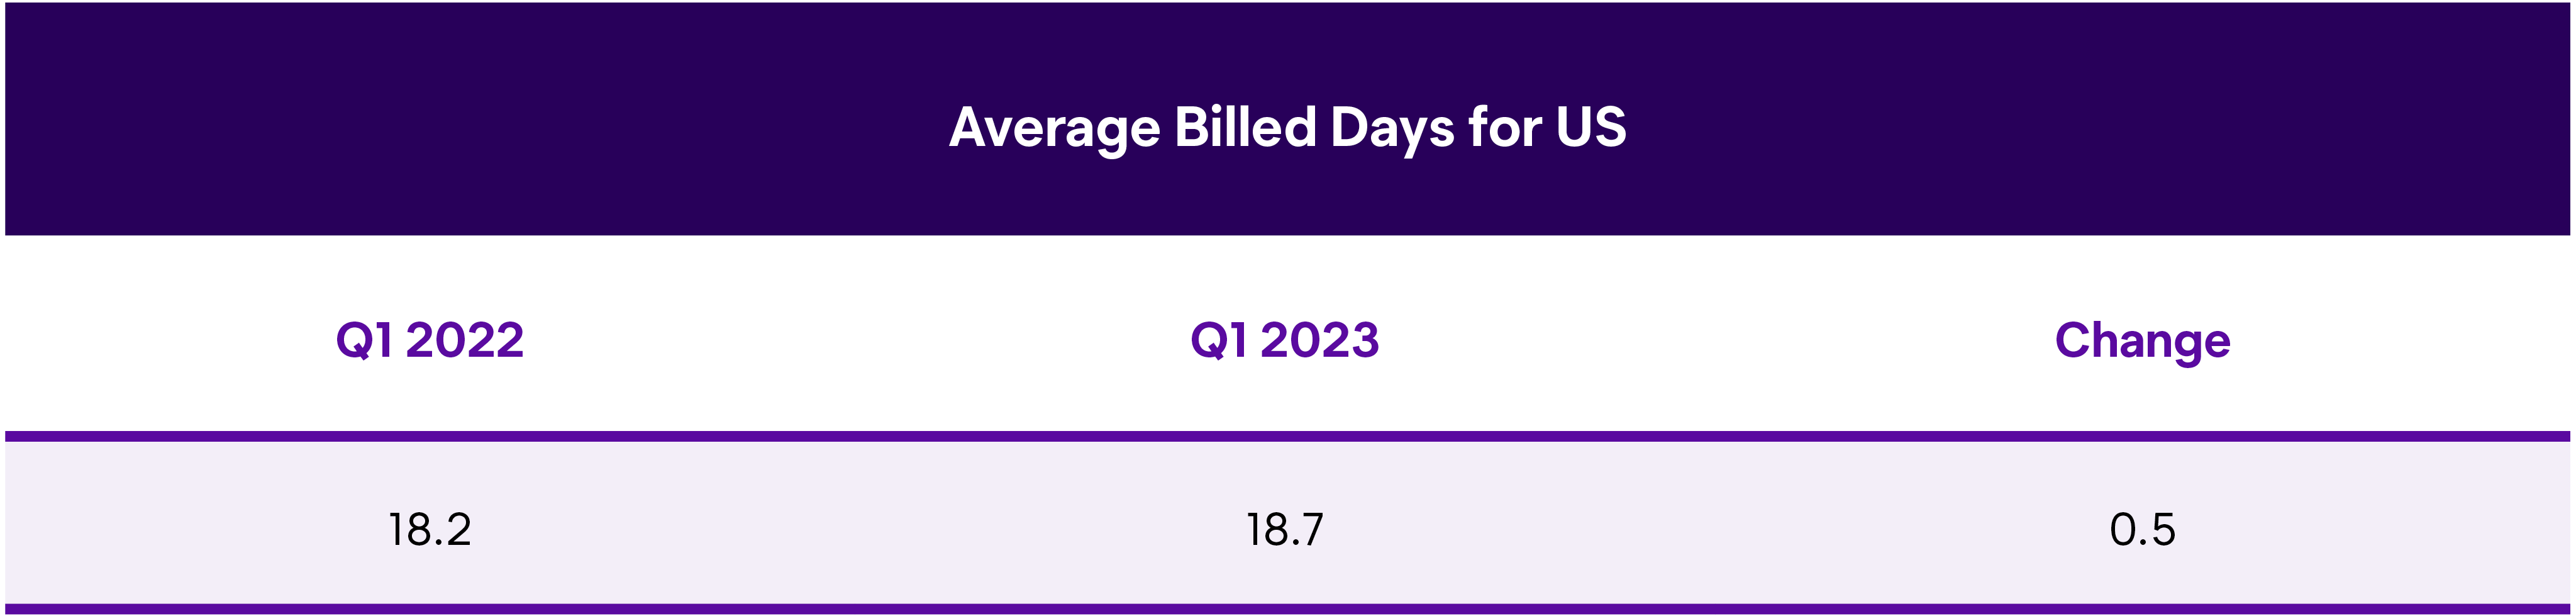
U.S. Length of Rental—Q1 2023
Length of Rental (LOR) in Q1 2023 was 18.7 days, an increase of one-half day from Q1 2022.
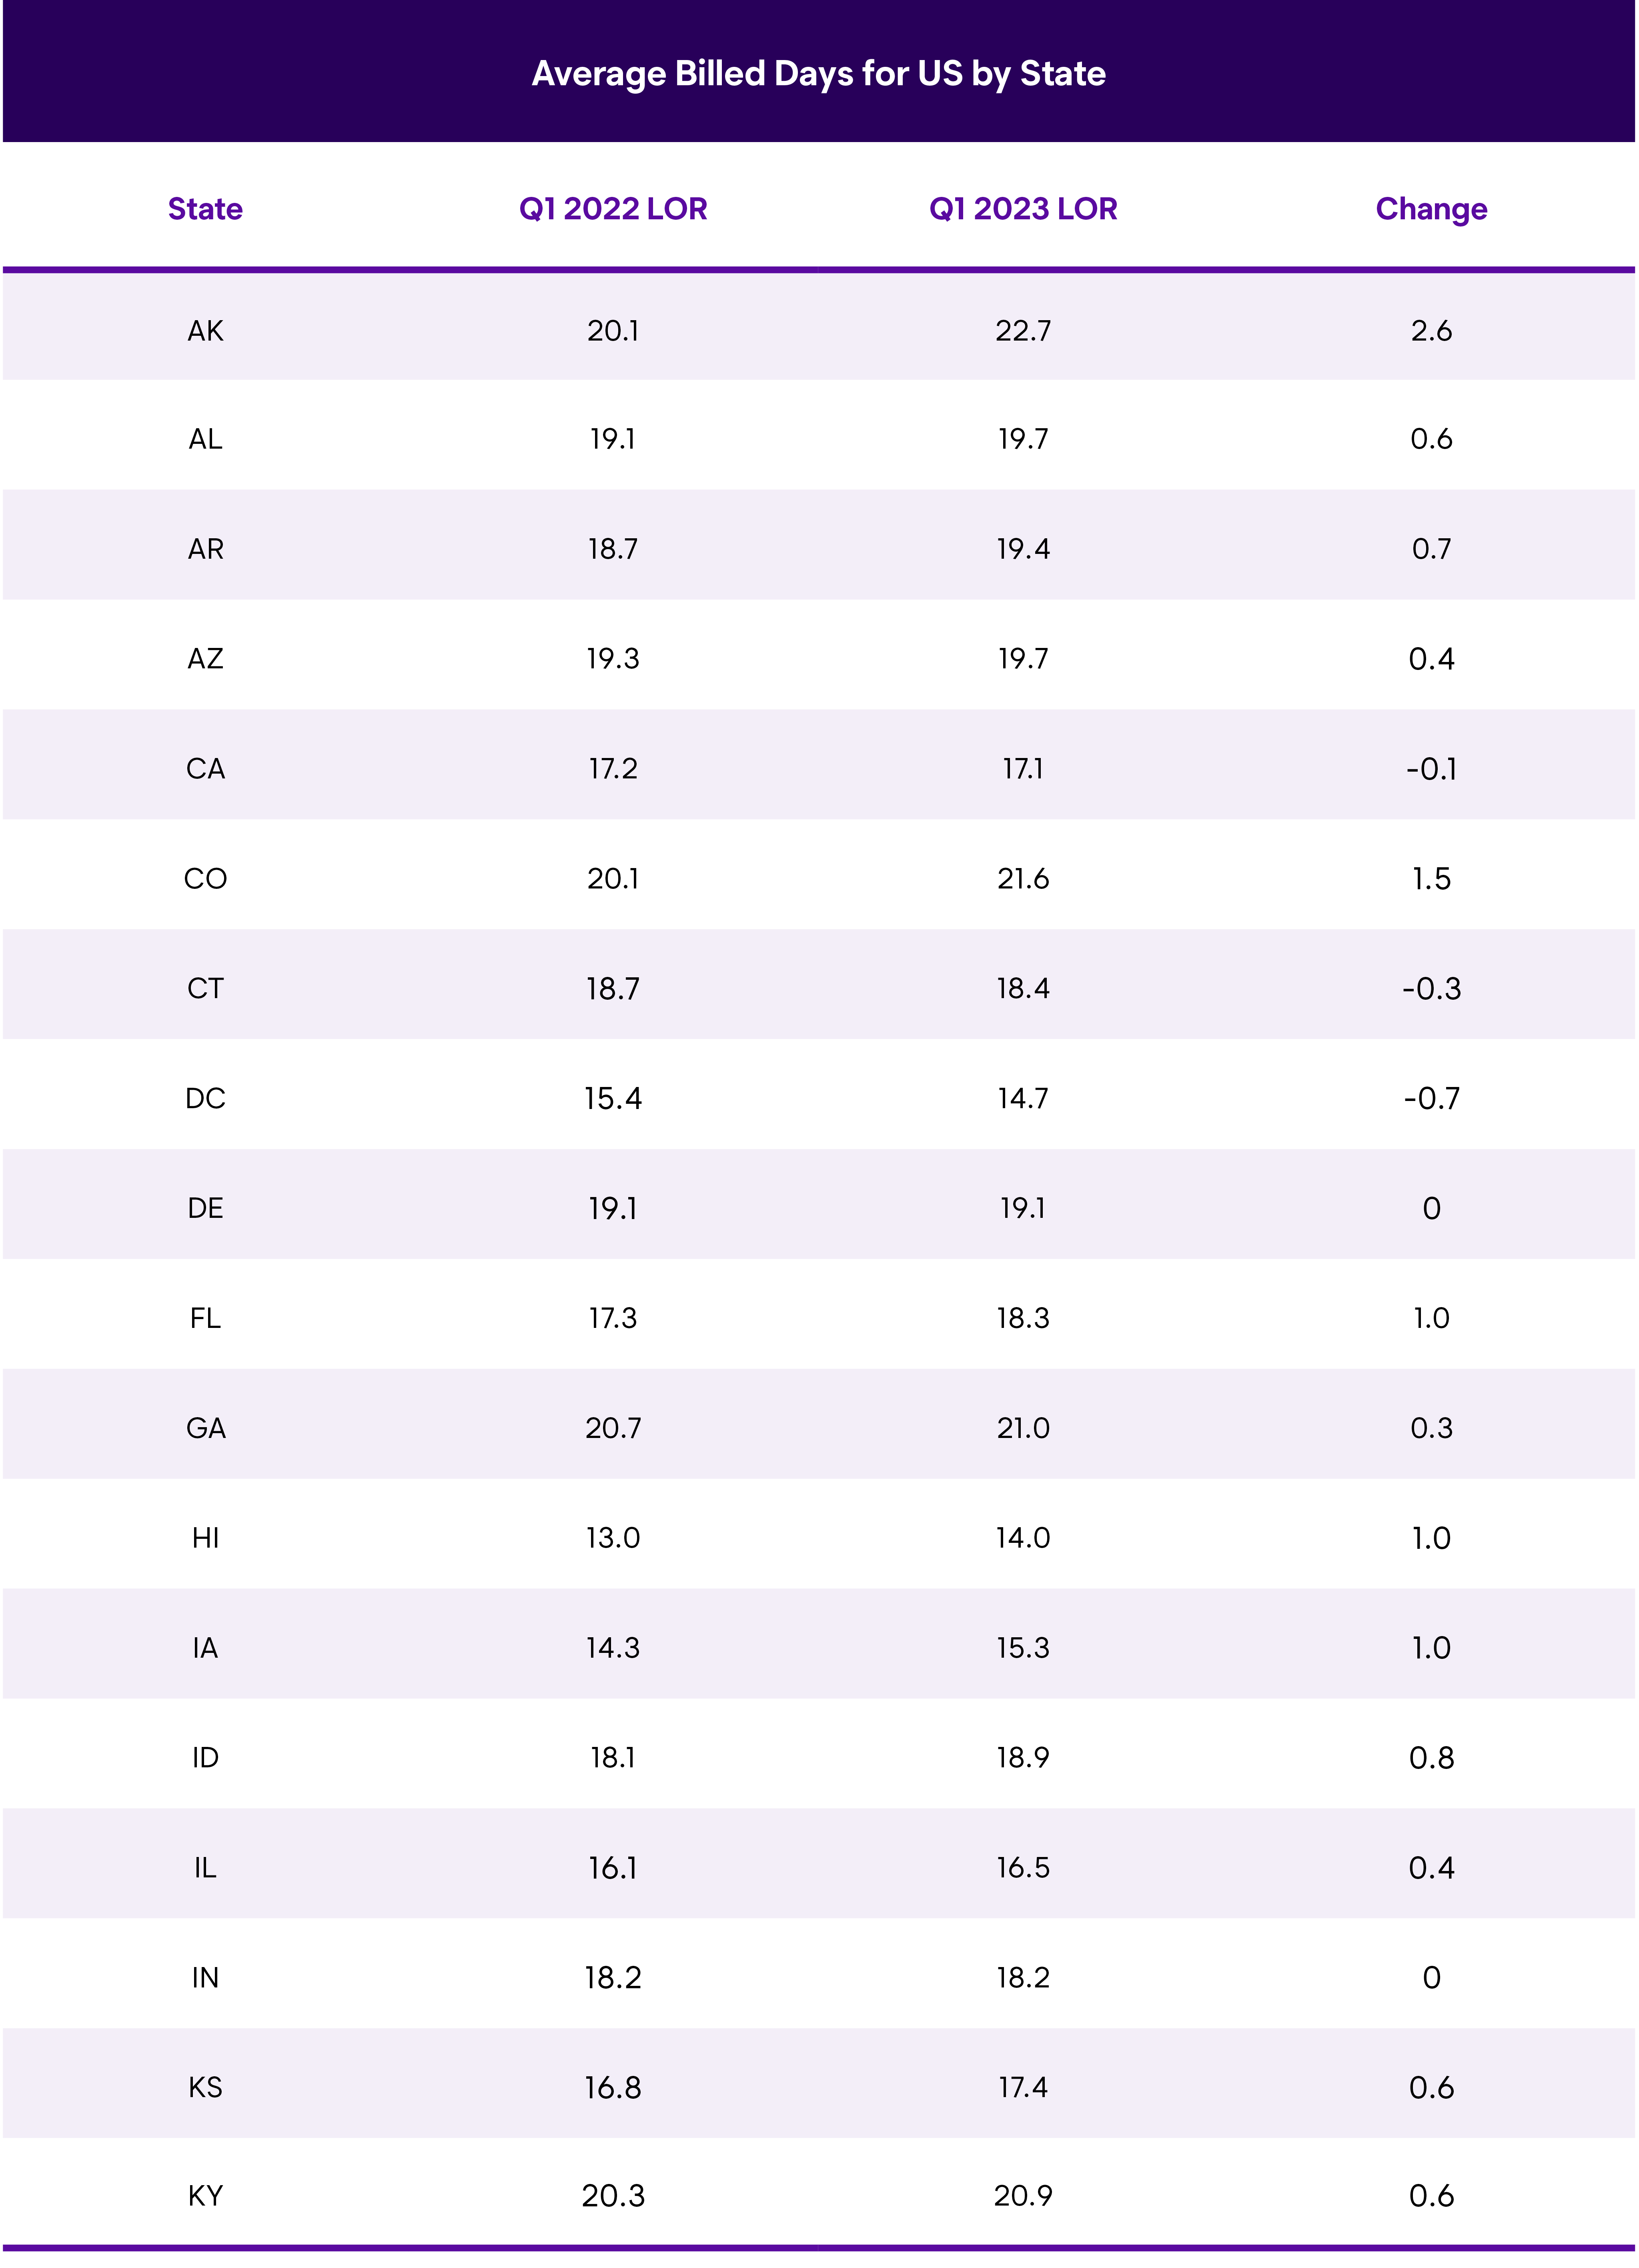
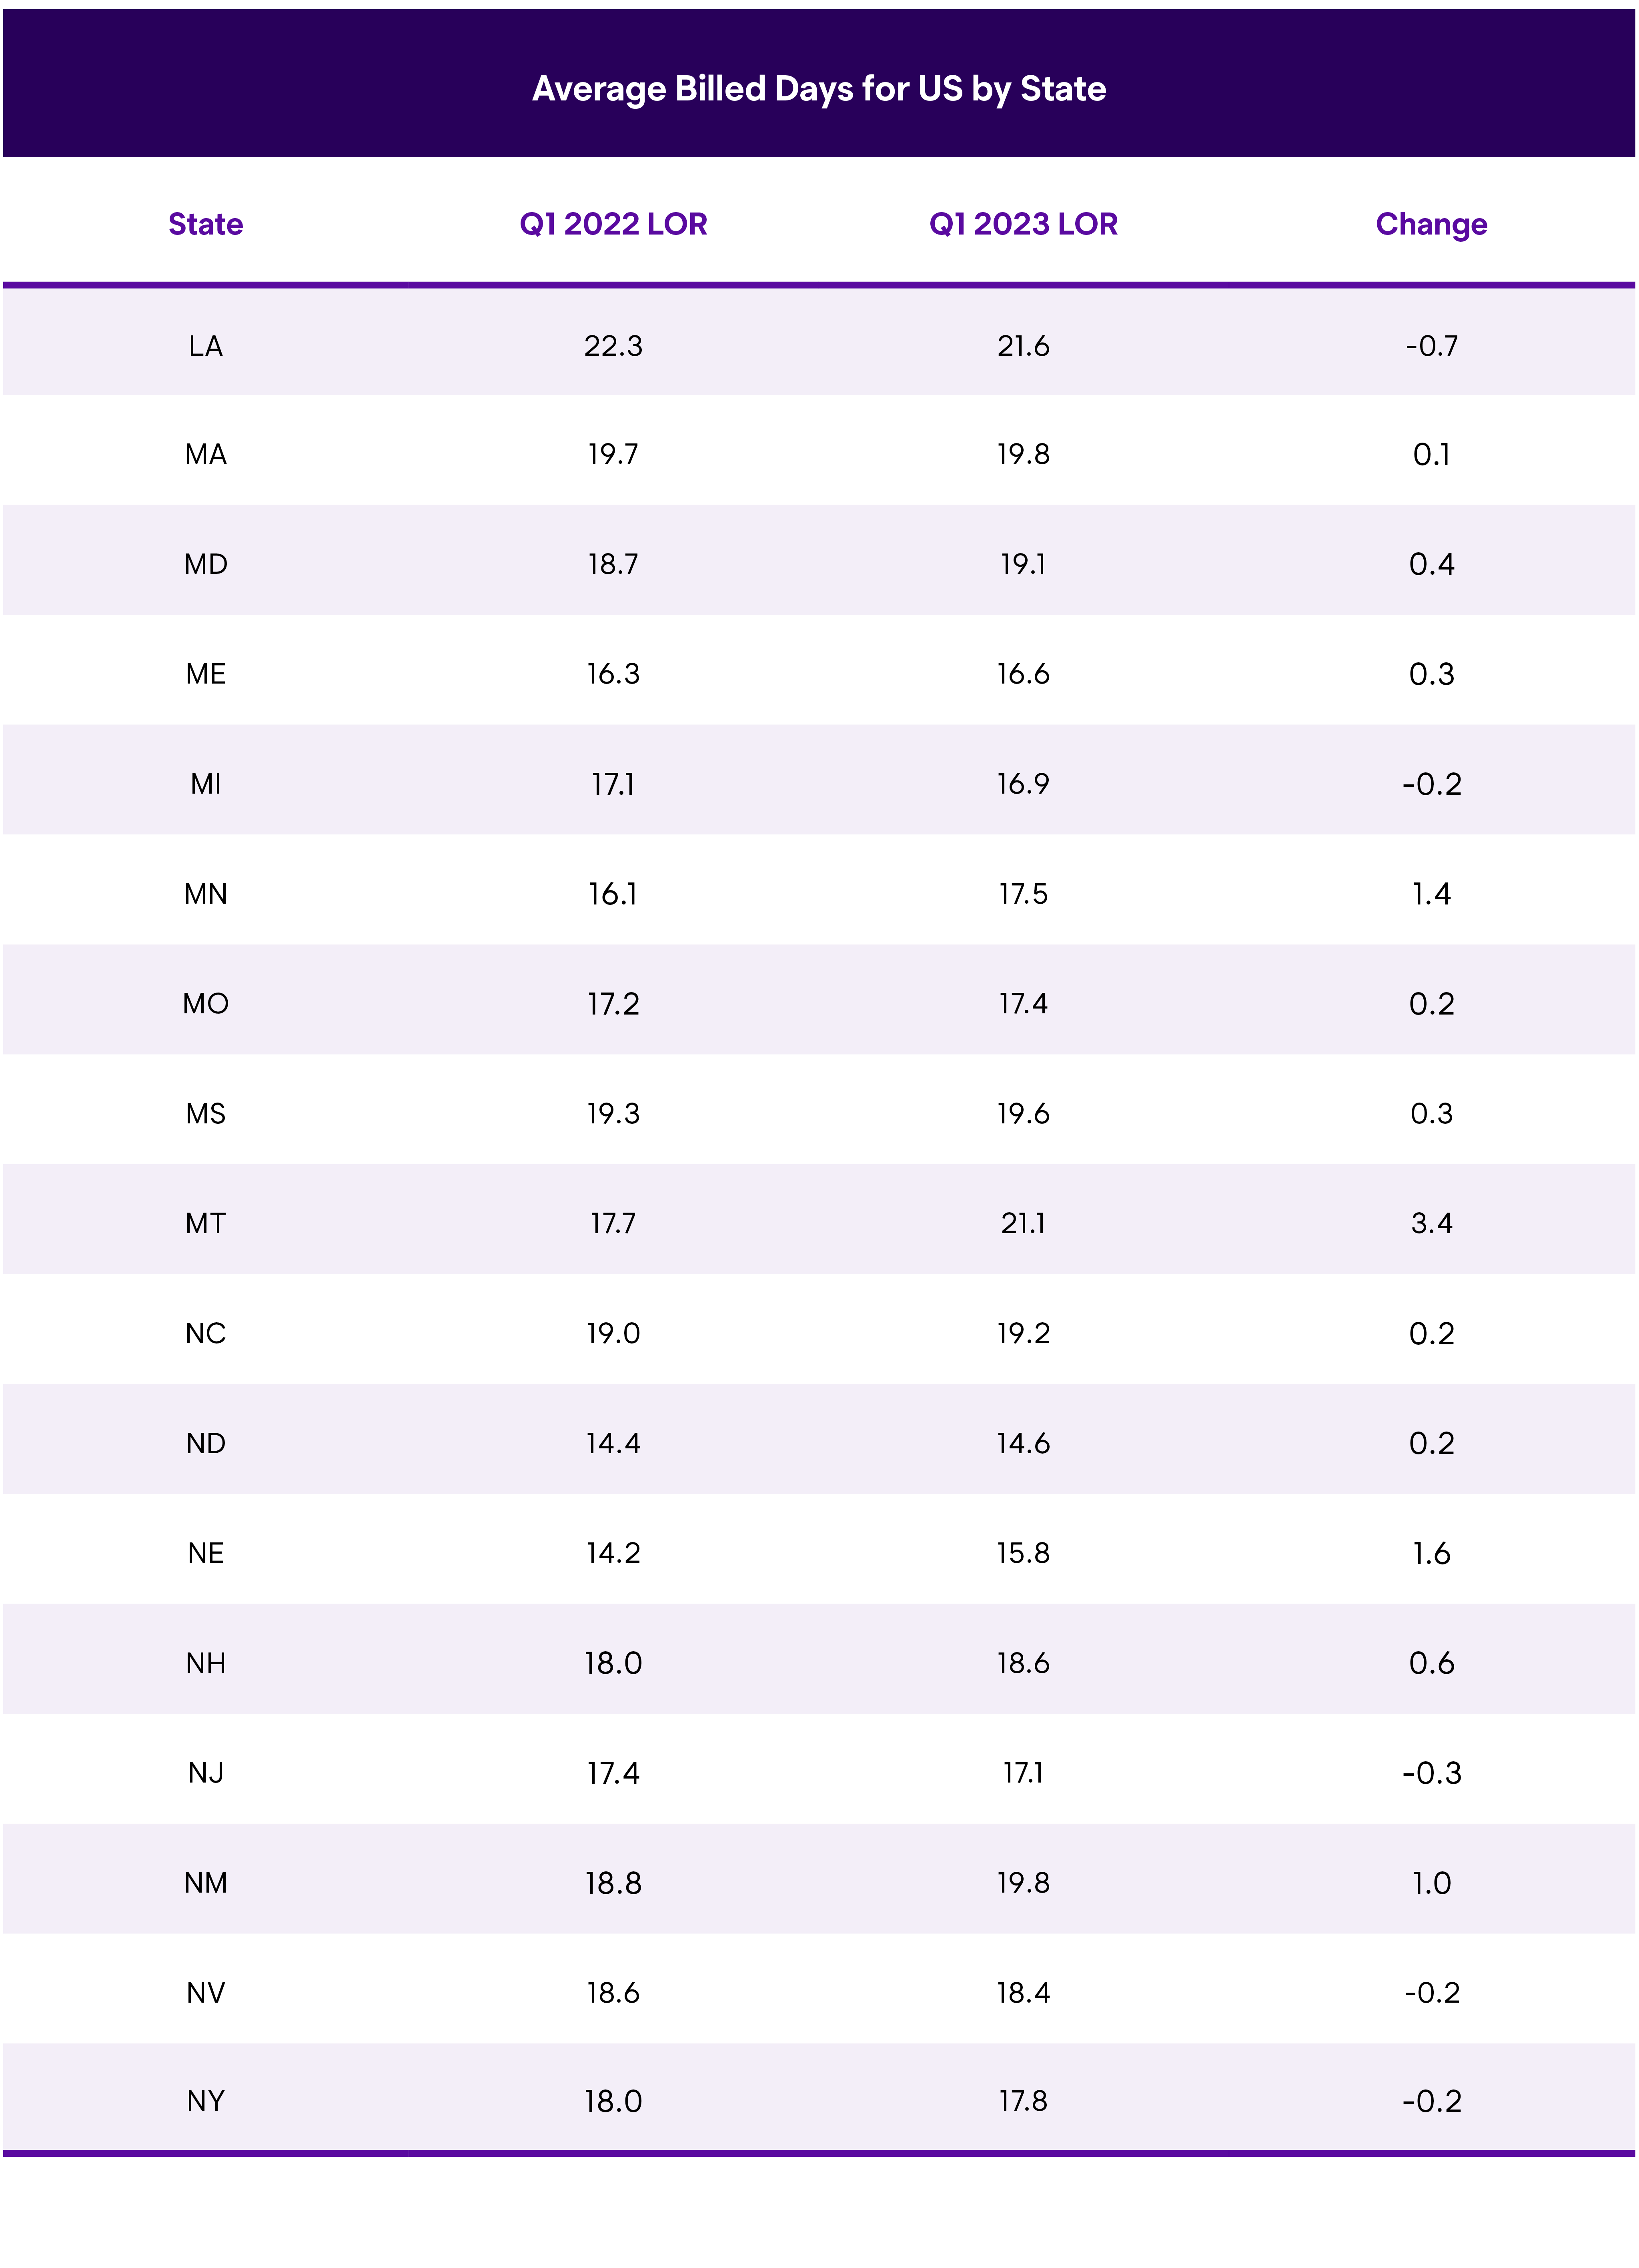
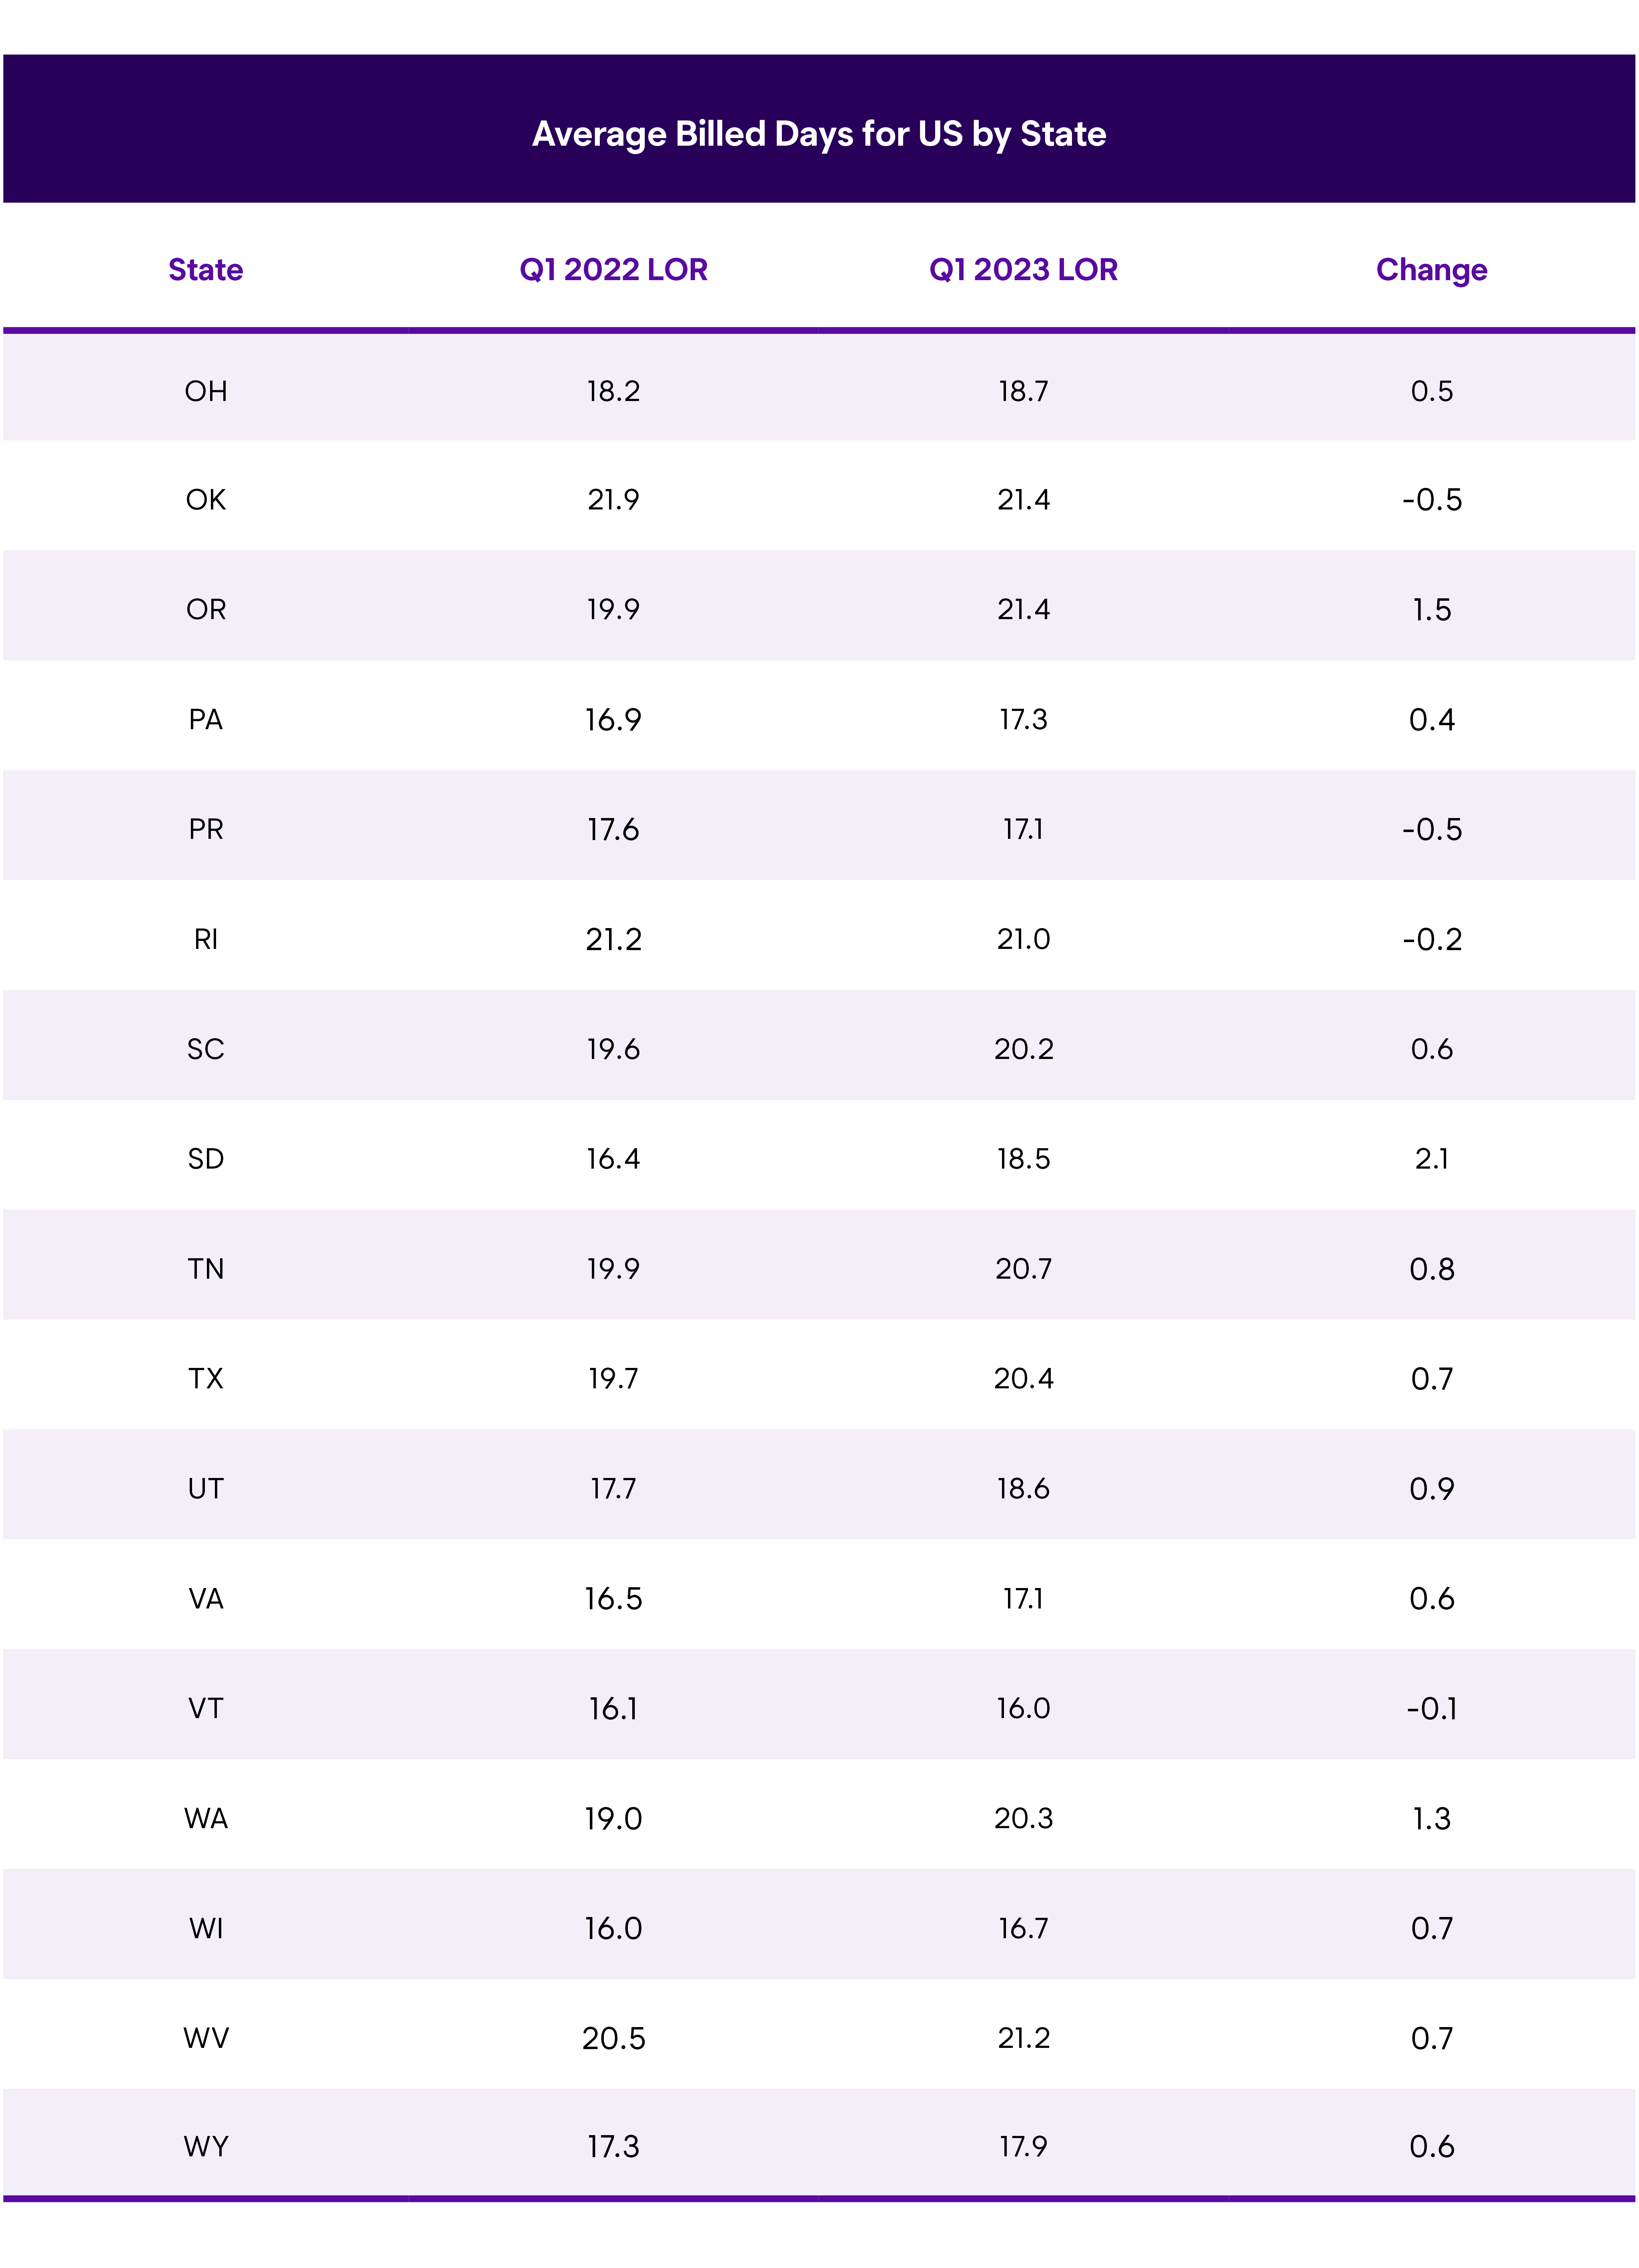
U.S. Average Length of Rental (LOR) By State—Q1 2023
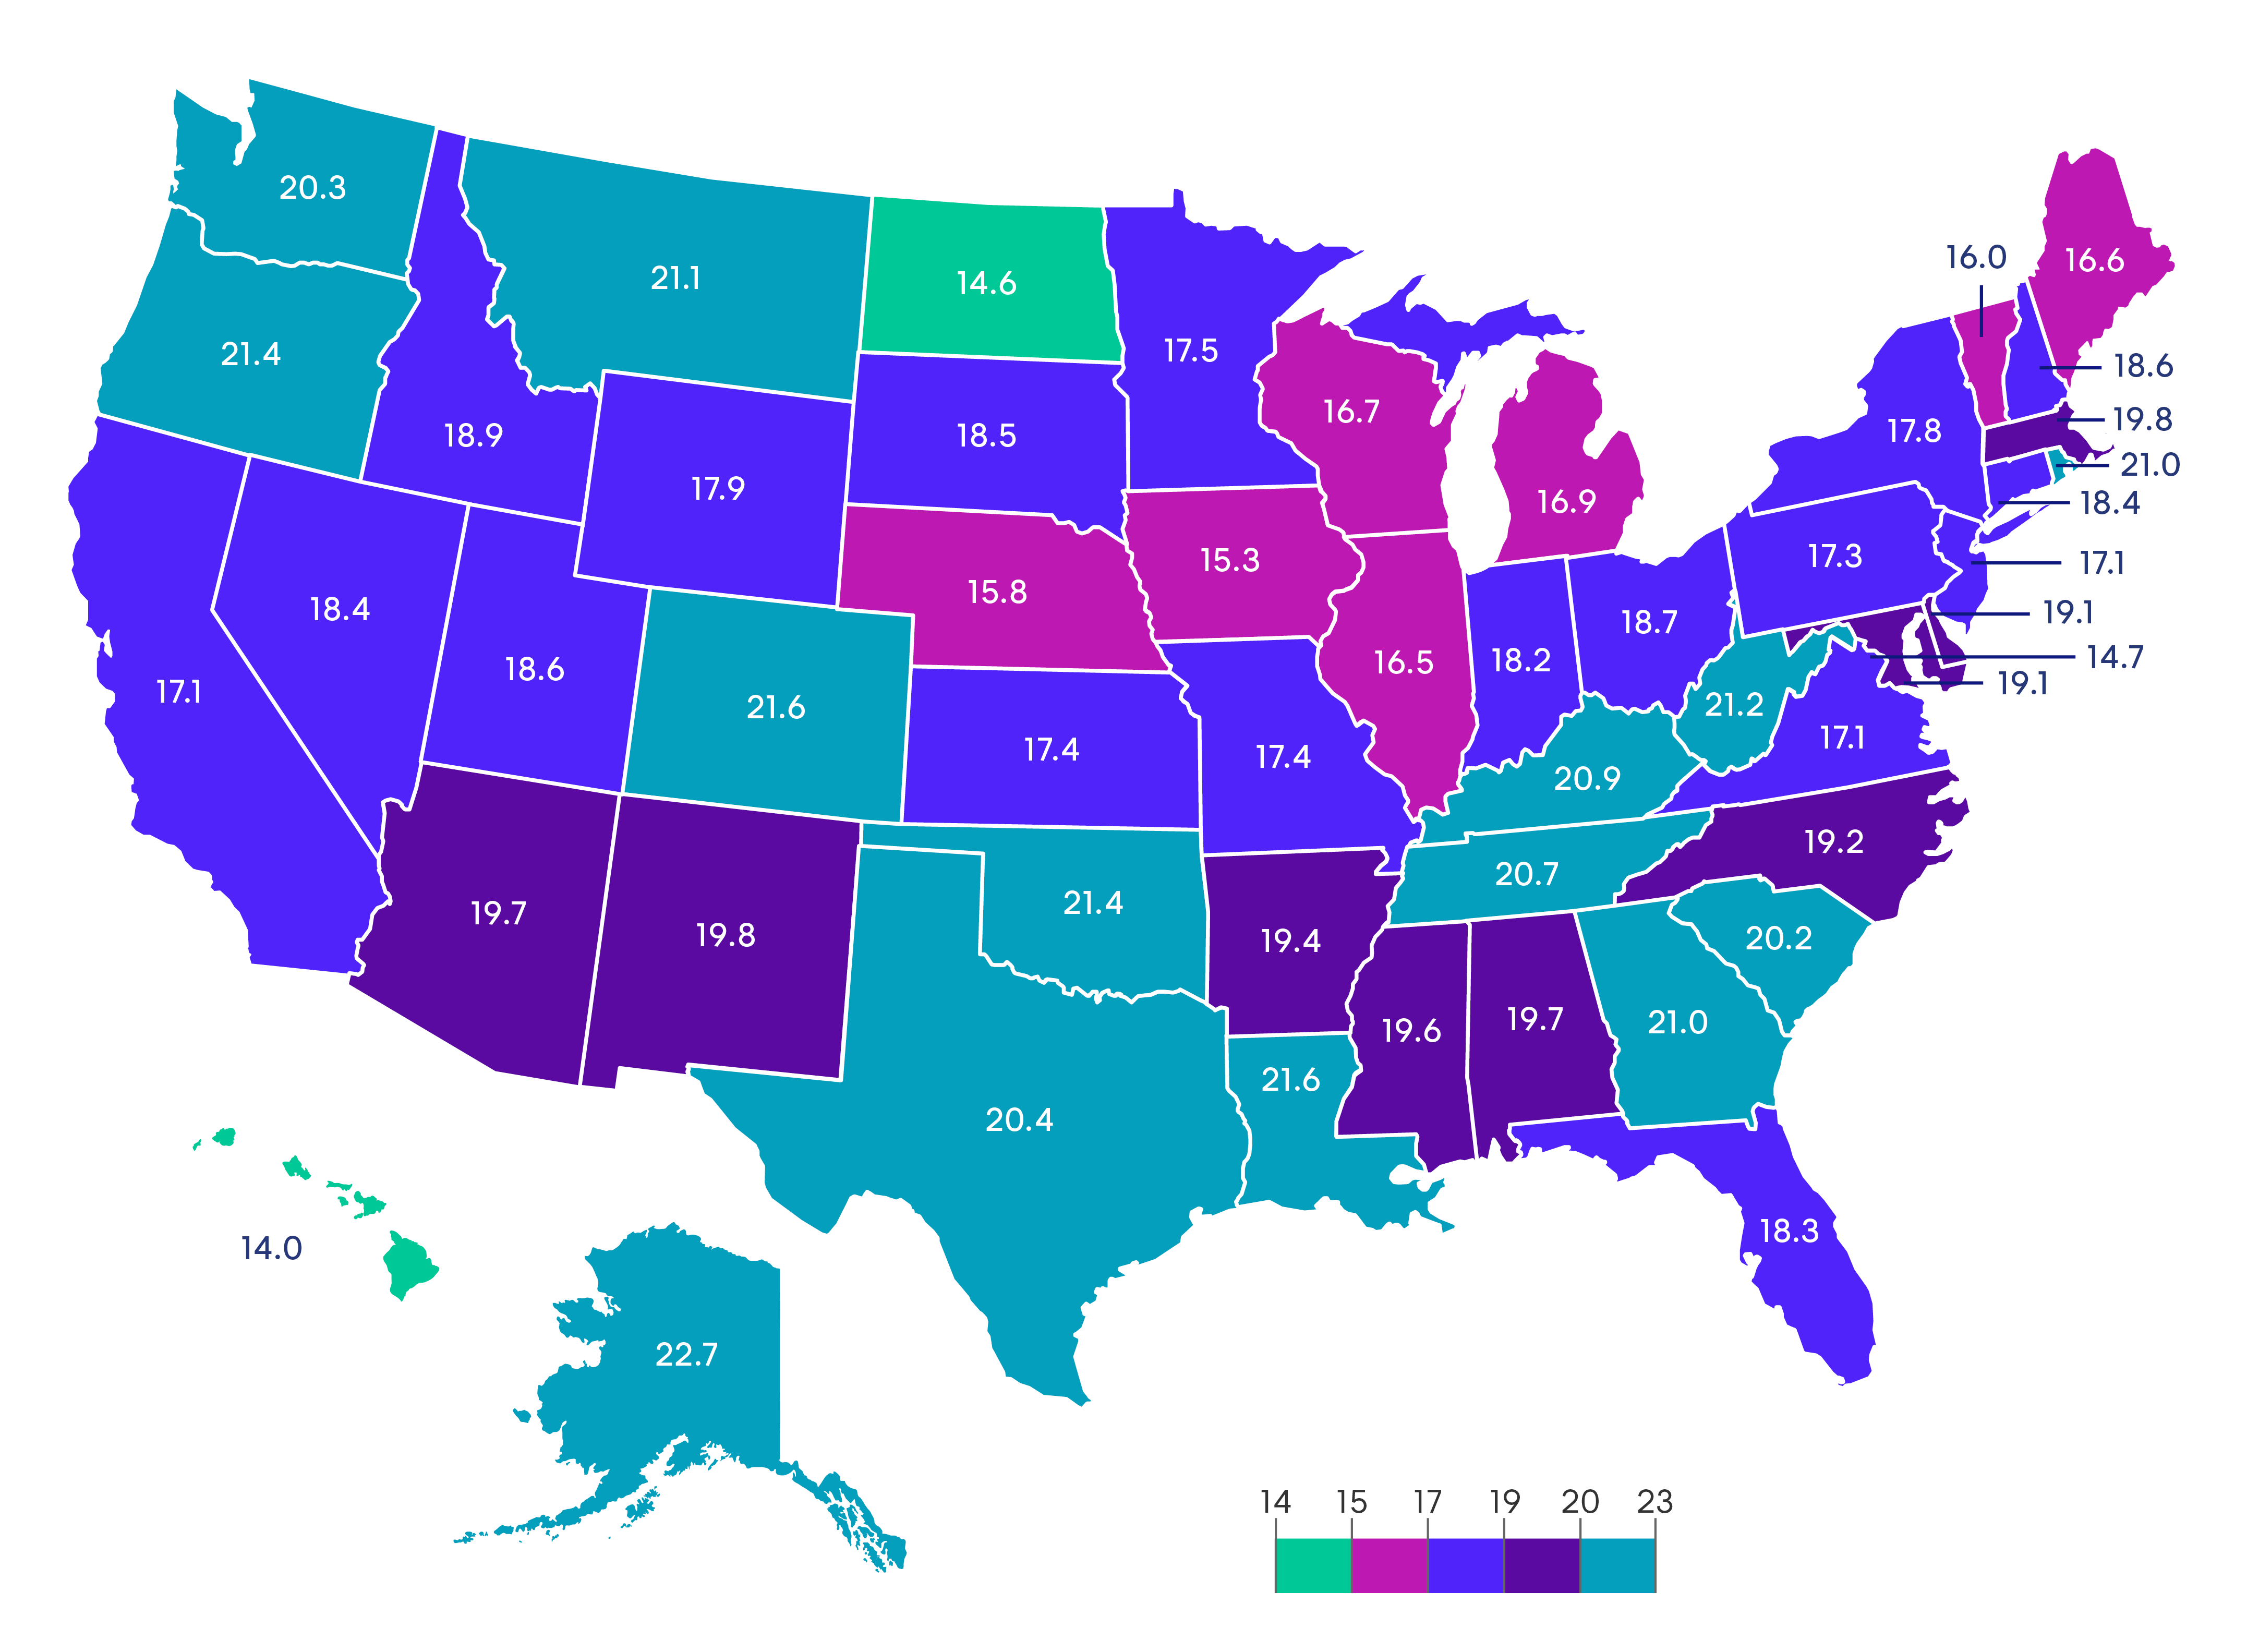
Excludes total losses.
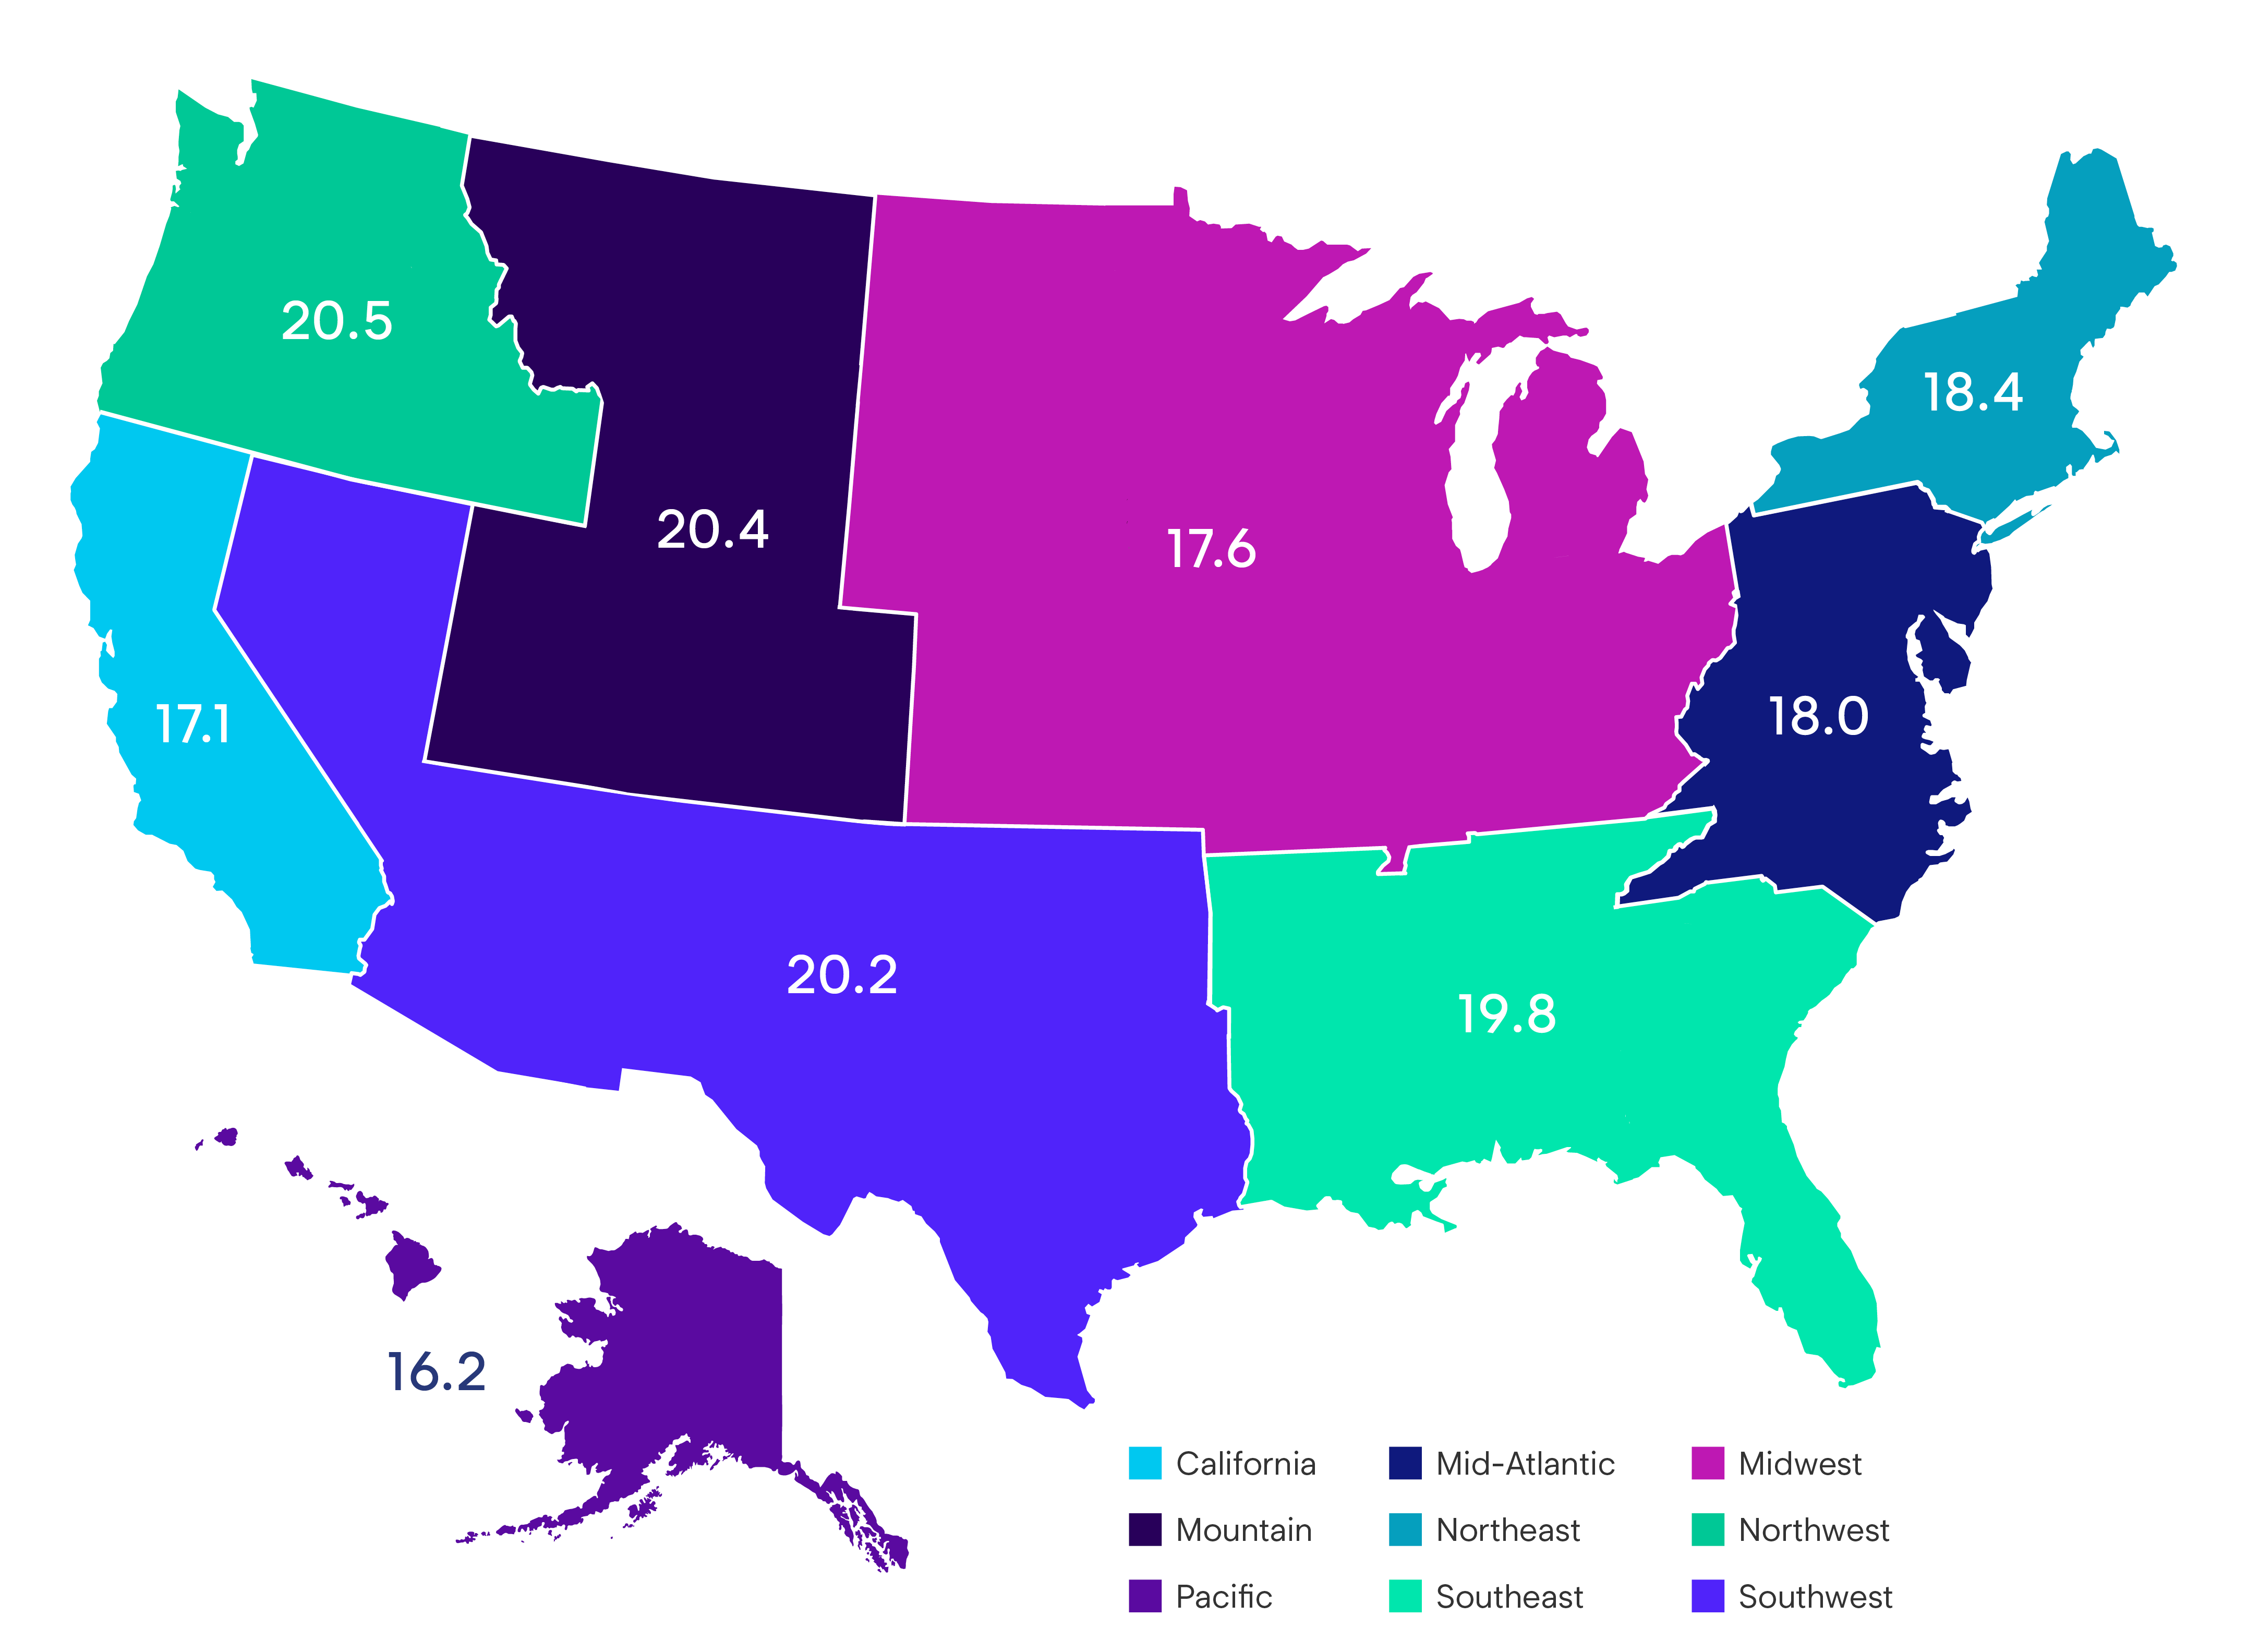
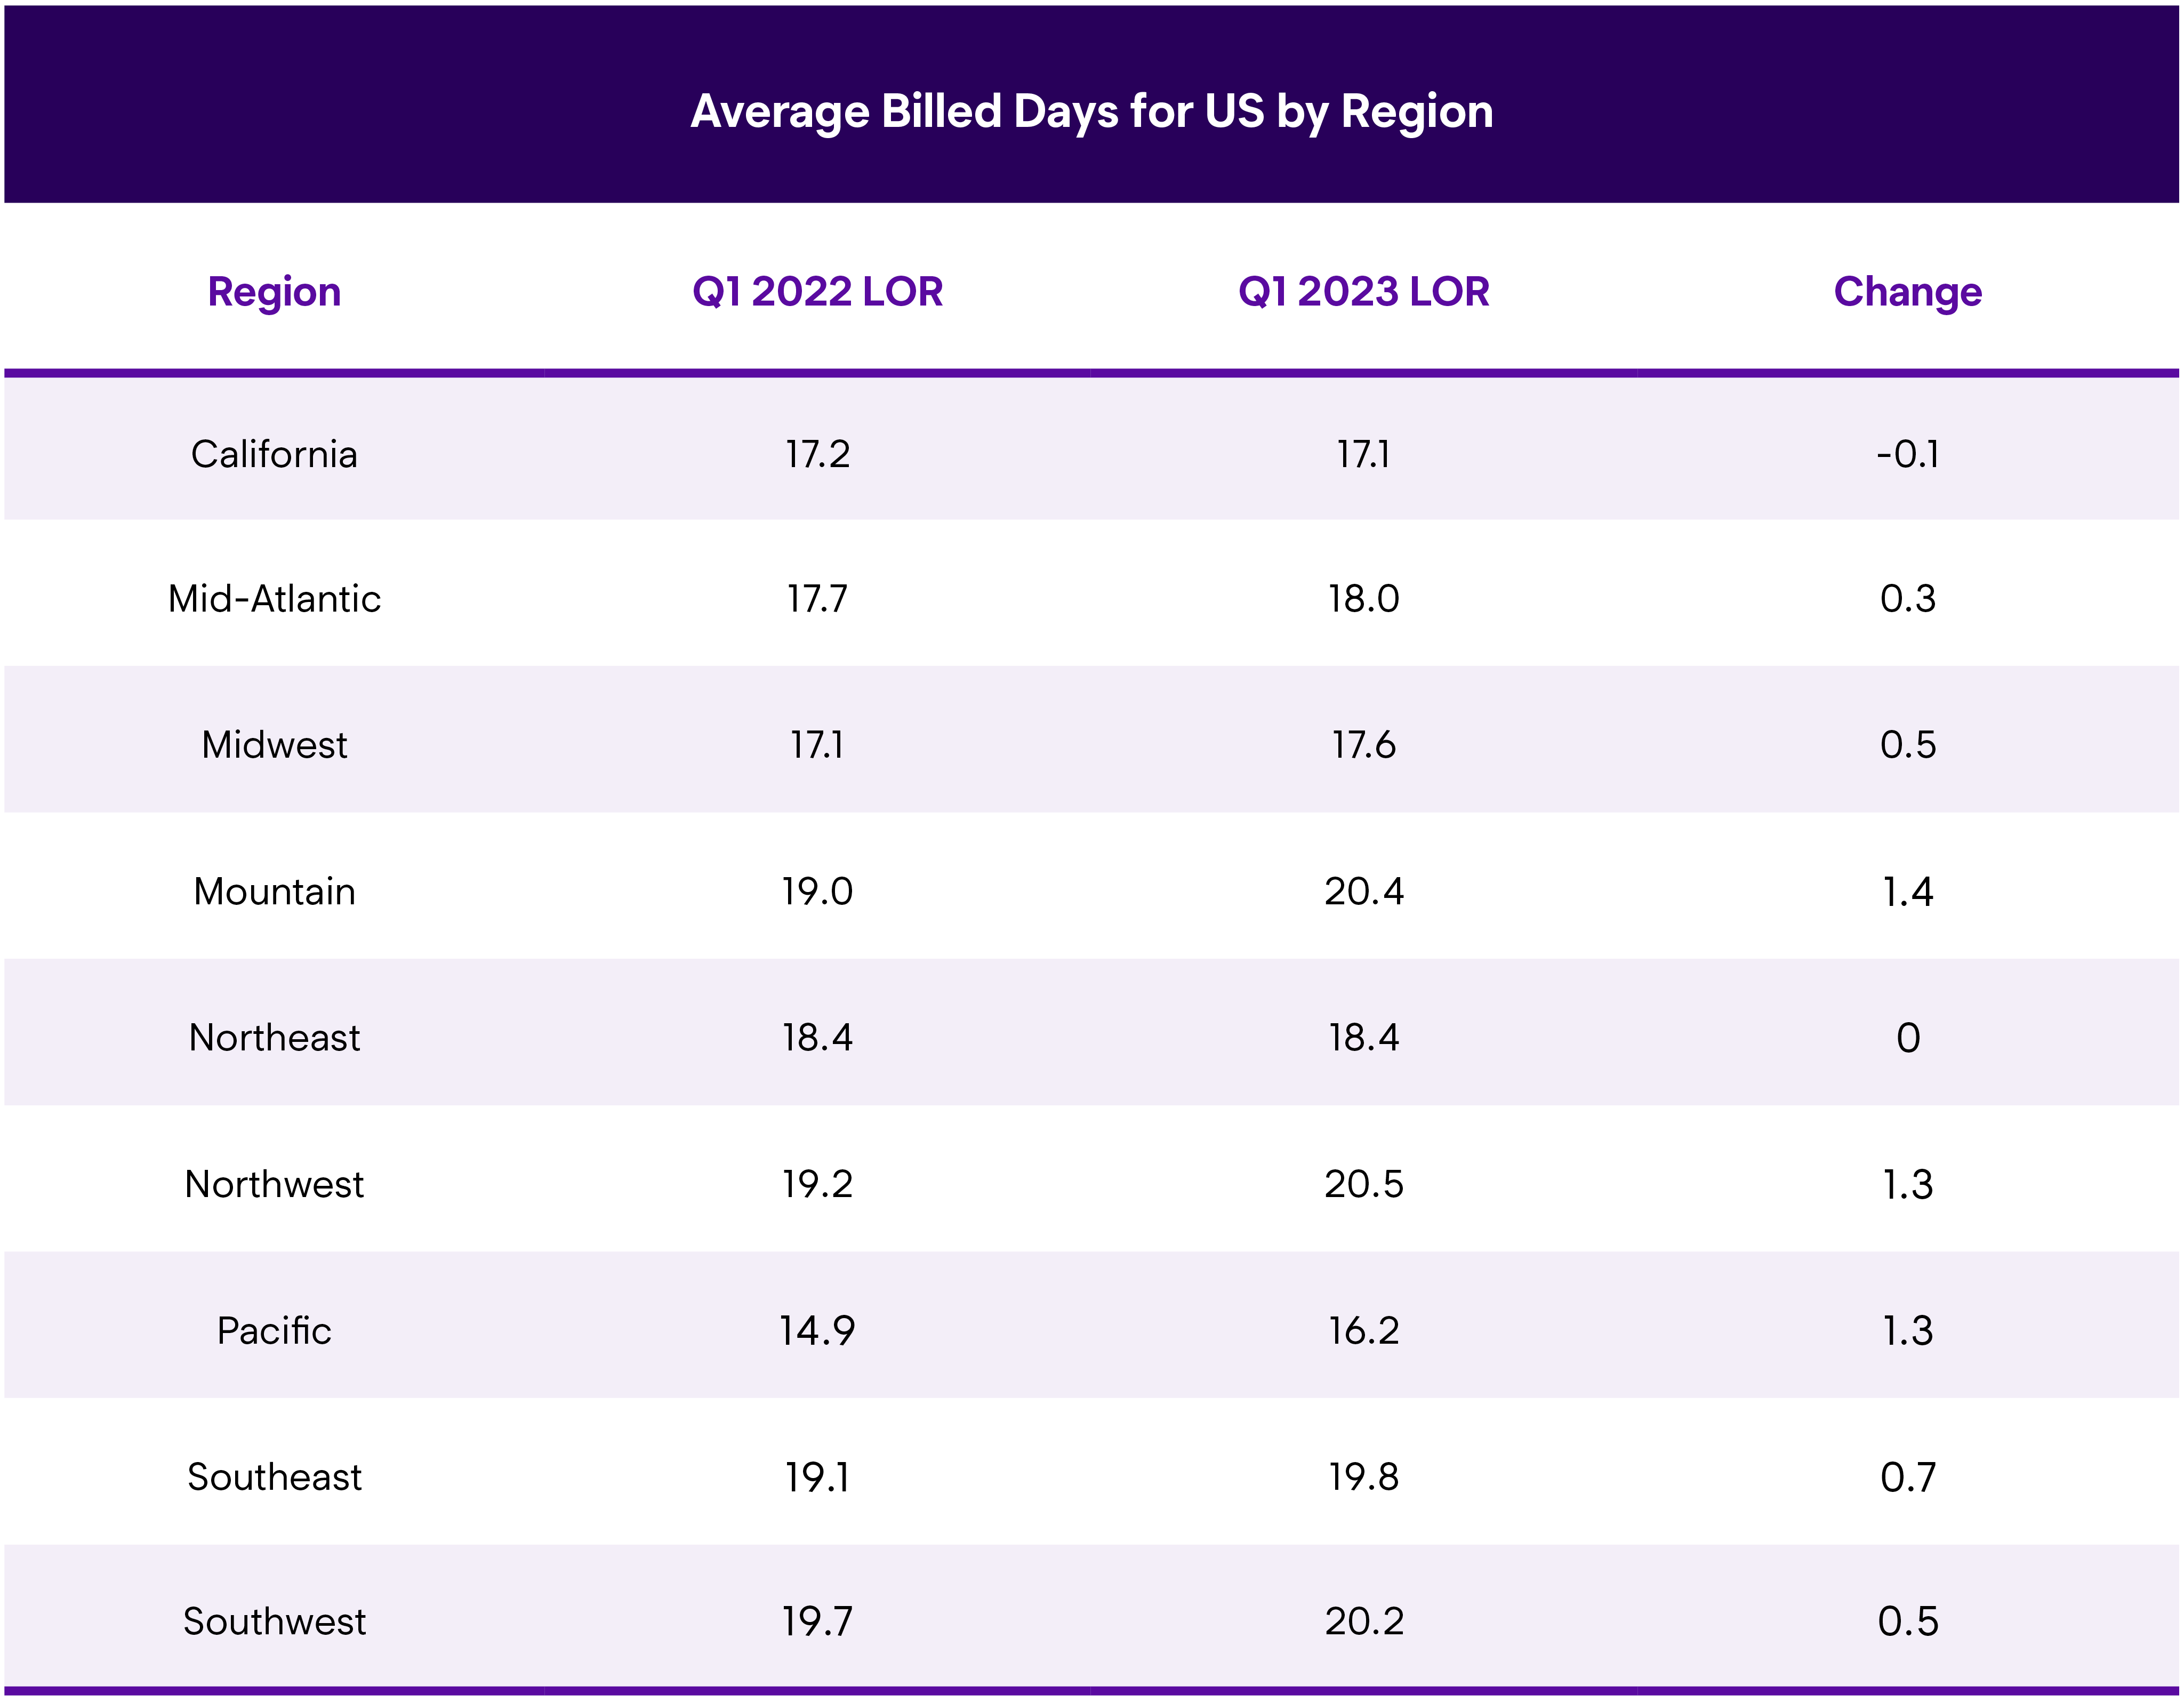
U.S. Average Length of Rental (LOR) By Region—Q1 2023
Overall
Alaska was highest at 22.7 days, followed by Colorado and Louisiana—both at 21.6. Oklahoma and Oregon were next highest at 21.4 days. Four additional states (West Virginia, Montana, Georgia and Rhode Island) had LOR of 21 days or greater.
Hawaii had lowest at 14.0 days, with North Dakota (14.6), Washington DC (14.7) Iowa (15.3) and Nebraska (15.8) next-lowest.
The highest year-over-year increases were seen with Montana (21.1) recording a 3.4-day increase from Q1 2022, while Alaska and South Dakota had the next highest increases—of 2.6 and 2.1 respectively. On a positive note, 26 states had increases less than a full day, while Indiana and Delaware were flat. Ten other states, plus DC, saw decreases in Q1 2023 from Q1 2022, with Louisiana and DC dropping by the most—0.7 days each.
What’s significant about the number of smaller increases and decreases is in reviewing Q1 2022 statistics. A year ago, there were no states that had overall LOR decreases; all states were higher with Hawaii showing the ‘lowest’ increase of 1.5 days over Q1 2021. When comparing this quarter to the last quarter (Q4 2022), only six states plus DC had increases less than a full day, again with no states seeing decreases.
John Yoswick, Editor of the weekly CRASH Network newsletter, shared that the national average backlog of work at U.S. shops set another record-high in January, reaching 5.8 weeks last month, up from 5.3 weeks in the last quarter of 2022. For the first time since they began tracking backlogs in 2017, fully 60% of shops in January were scheduling work four or more weeks into the future. Of the more than 700 shops that responded to the survey, almost 9 in 10 (87%) were scheduling two weeks or more into the future, and only eight shops (1.1%) said they currently had no backlog and could schedule work immediately.
The percentage of shops with an opening for one or more body techs dipped slightly in the fourth quarter of 2022 for the first time since the early days of the pandemic. But those changes weren’t dramatic. Nearly two-thirds of shops (65%) still said they would like to hire another body technician.
Greg Horn, PartsTrader’s Chief Innovation Officer, who oversees their data analytics department, looked at overall delivery days for all parts on a state level and found an interesting pattern emerge for Q1 2023 that mirrored Enterprise’s rental trends: “In looking at our delivery days charts, I was once again struck at the similarity in our delivery day trends and Enterprise’s Length of Rental. For Q1 2022, we did not track a single state that decreased in overall delivery days from Q1 2021. But for Q1 2023, we saw a mix of increases and decreases in same quarter/year over year days.”
At a state level, PartsTrader tracked 7 of the 10 states showing similar decreases to Enterprise’s results. The remaining three states where Enterprise showed a decrease in LOR from Q1 2022 showed the delivery days were identical between Q1 2023 and Q1 2022. Horn concluded, “Replacement parts make up the majority of costs of an estimate, and delays in parts delivery will impact length of rental. However, body and paint labor are the second-highest cost component and also drive cycle times. Parts fulfillment is improving, but shop technician shortages still impact overall cycle time.”
Yoswick also added, “Almost 40% of shops in December said they were experiencing fewer parts challenges in recent months than they had in late 2021. A third of shops said they had seen no change in terms of parts challenges, with more than 1 in 4 (27%) saying parts-related issues had actually increased.”
Ryan Mandell, Director of Claims Performance for Mitchell International, shared: “The environment for parts availability appears to be consistently improving, especially in regard to aftermarket parts. The utilization of alternative parts increased from 34.98% in Q1 2022 to 37.02% in Q1 2023. Additionally, the rate of repair for collision repairs also improved by over a full percentage point from 17% in Q1 2022 to 18.14% in Q1 2023.”
Drivable
Drivable LOR in Q1 2023 was 16.1 days, a 0.6-day increase over Q1 2022. Georgia had the highest LOR at 18.8 days, followed by Oklahoma (18.7), Rhode Island (18.6) and Oregon (18.5). Alaska, Louisiana, Colorado, Texas and Tennessee all had drivable LOR above 18 days.
North Dakota recorded the lowest drivable LOR with 10.9 days, followed by Hawaii (11.8), Washington DC (12.0), Iowa (12.7) and Vermont (12.7).
Alaska saw the highest increase with drivable LOR up a full 3.0 days (18.4), while Montana was up 2.4 days (16.4). While nearly every state saw a drivable LOR increase, only eight of them were greater than a full day. Washington DC had the lowest decrease by a full day (12.0), while Louisiana saw a half-day decrease (18.4). As with overall LOR, no states showed any decrease when comparing this quarter last year (Q1 2022) to the same quarter a year prior (Q1 2021).
Non-Drivable
LOR for rentals associated with non-drivable claims was 27.5, an increase of 0.8 days over Q1 2022. Montana had the highest LOR with 34.5 days, followed by West Virginia (33.9), Colorado (33.3), Washington (33.1), and Oregon (33.0). Ten additional states had LOR of 30 days or greater, while 13 more had LOR at or above 28 days. In Q1 2022, only five states had a non-drivable LOR above 30 days.
New York had the lowest non-drivable LOR at 22.9 days, with four states (Iowa, Michigan, Massachusetts, and California) plus DC posting LOR under 25 days.
Montana had the highest increase, jumping up 5.6 days from Q1 2022. Alaska and Colorado had increases of 3.8 days, while five other states increased 3 days or more. Seven states, led by New York (-1.6), had decreases from Q1 2022, and California’s non-drivable LOR results were static. While Q1 2022 had no states with any decrease from the previous year - in fact, the lowest increase was 4.1 days - the overall increase was impacted through 42 states plus DC all seeing higher results in Q1 2023.
Total Loss Claims
Total Loss LOR in Q1 23 was 18.4 days, a small decrease of 0.1 days from Q1 2022. While negligible, it does contrast against the Total Loss increase of 4.1 days that we saw between Q1 2022 and Q1 2021.
Hawaii (+5.5) and Wyoming (+5.0) saw the highest increases, with Kansas showing the next highest increase over Q1 2022 at 3.0 days. Four states had flat results, and 22 states plus DC all saw decreases. Idaho (17.7) saw results down by 3.8 days, and Rhode Island, Massachusetts and DC saw decreases of 2.5 days.
Canadian Average Length of Rental (LOR) By Province—Q1 2023
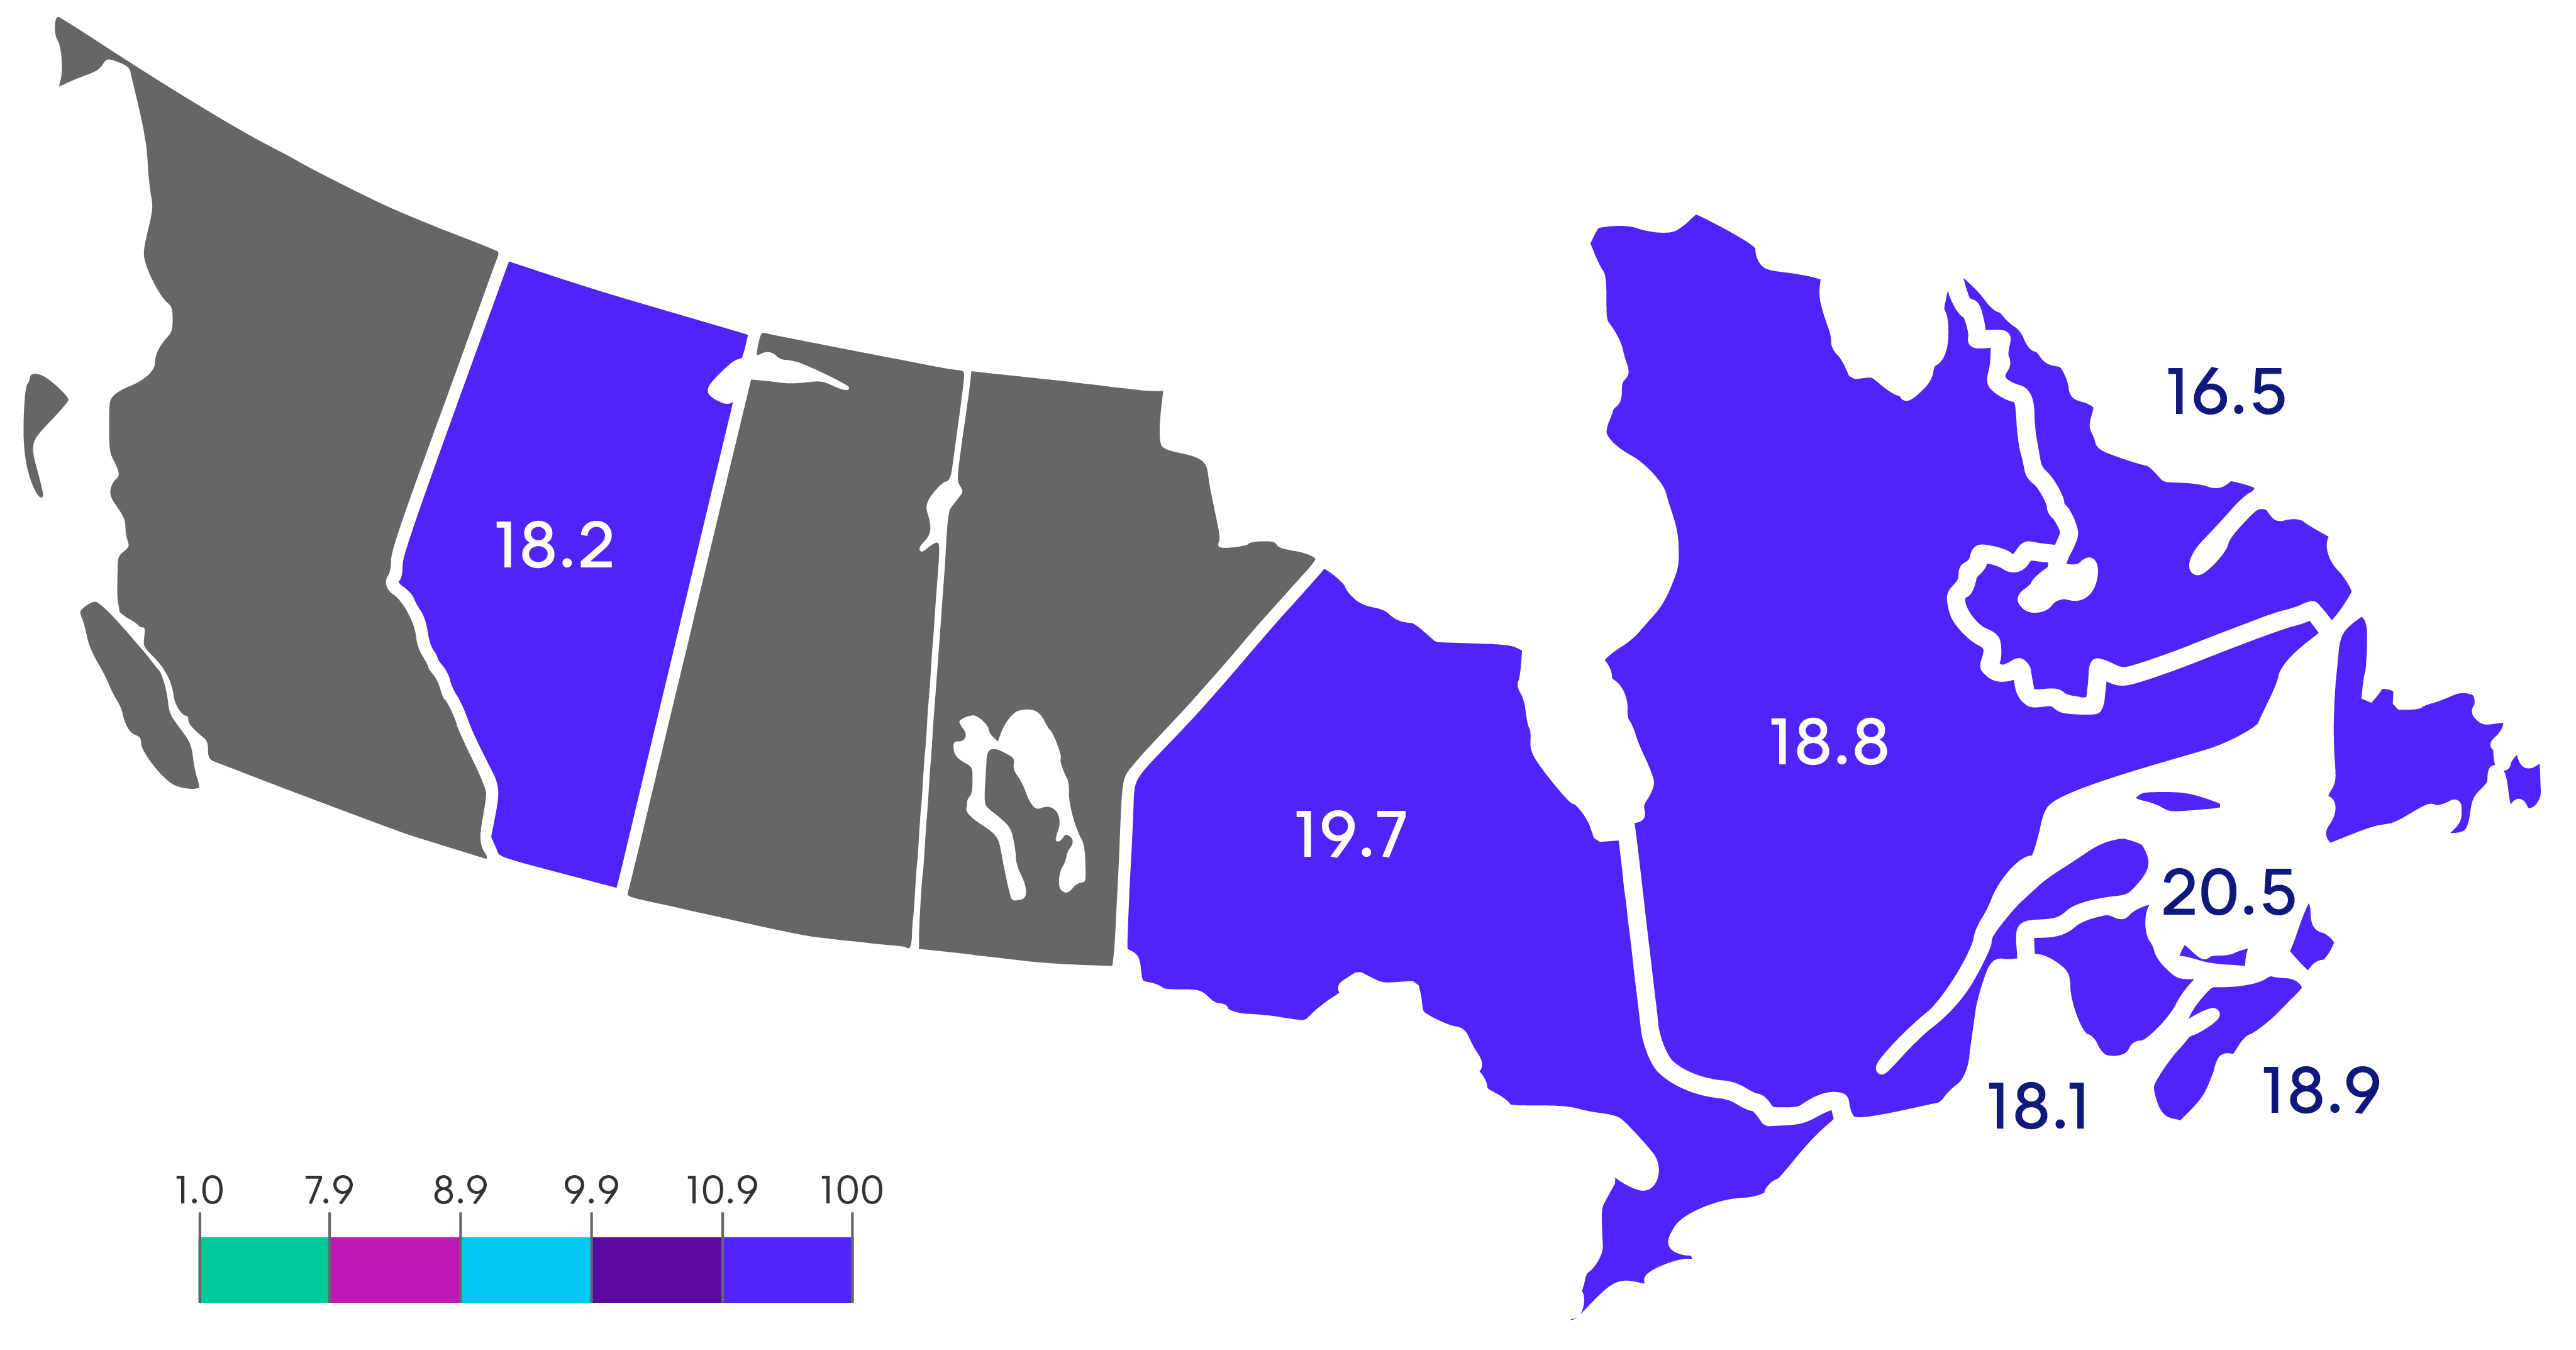
Excludes total losses.
Overall
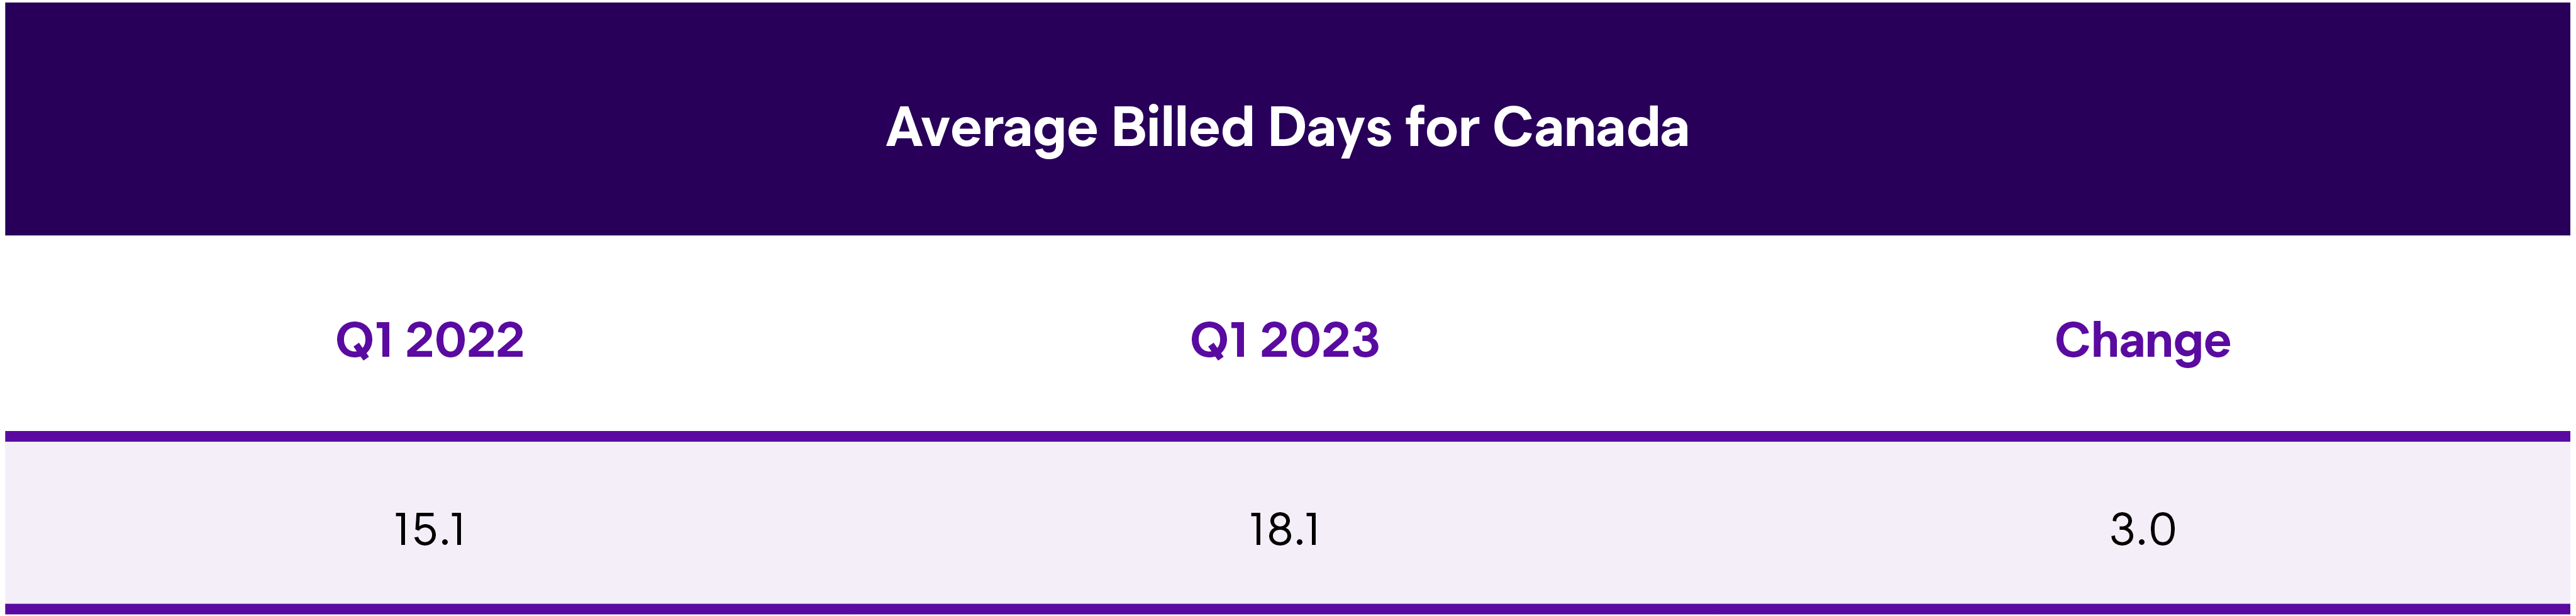
The overall Length of Rental (LOR) for rentals associated with automobile claims was 18.1 in Q1 2023, representing a full 3.0-day increase from Q1 2022. While this is high, it is a smaller overall increase than the one we saw in Q4 2022 compared to Q4 2021 (+4.3 days).
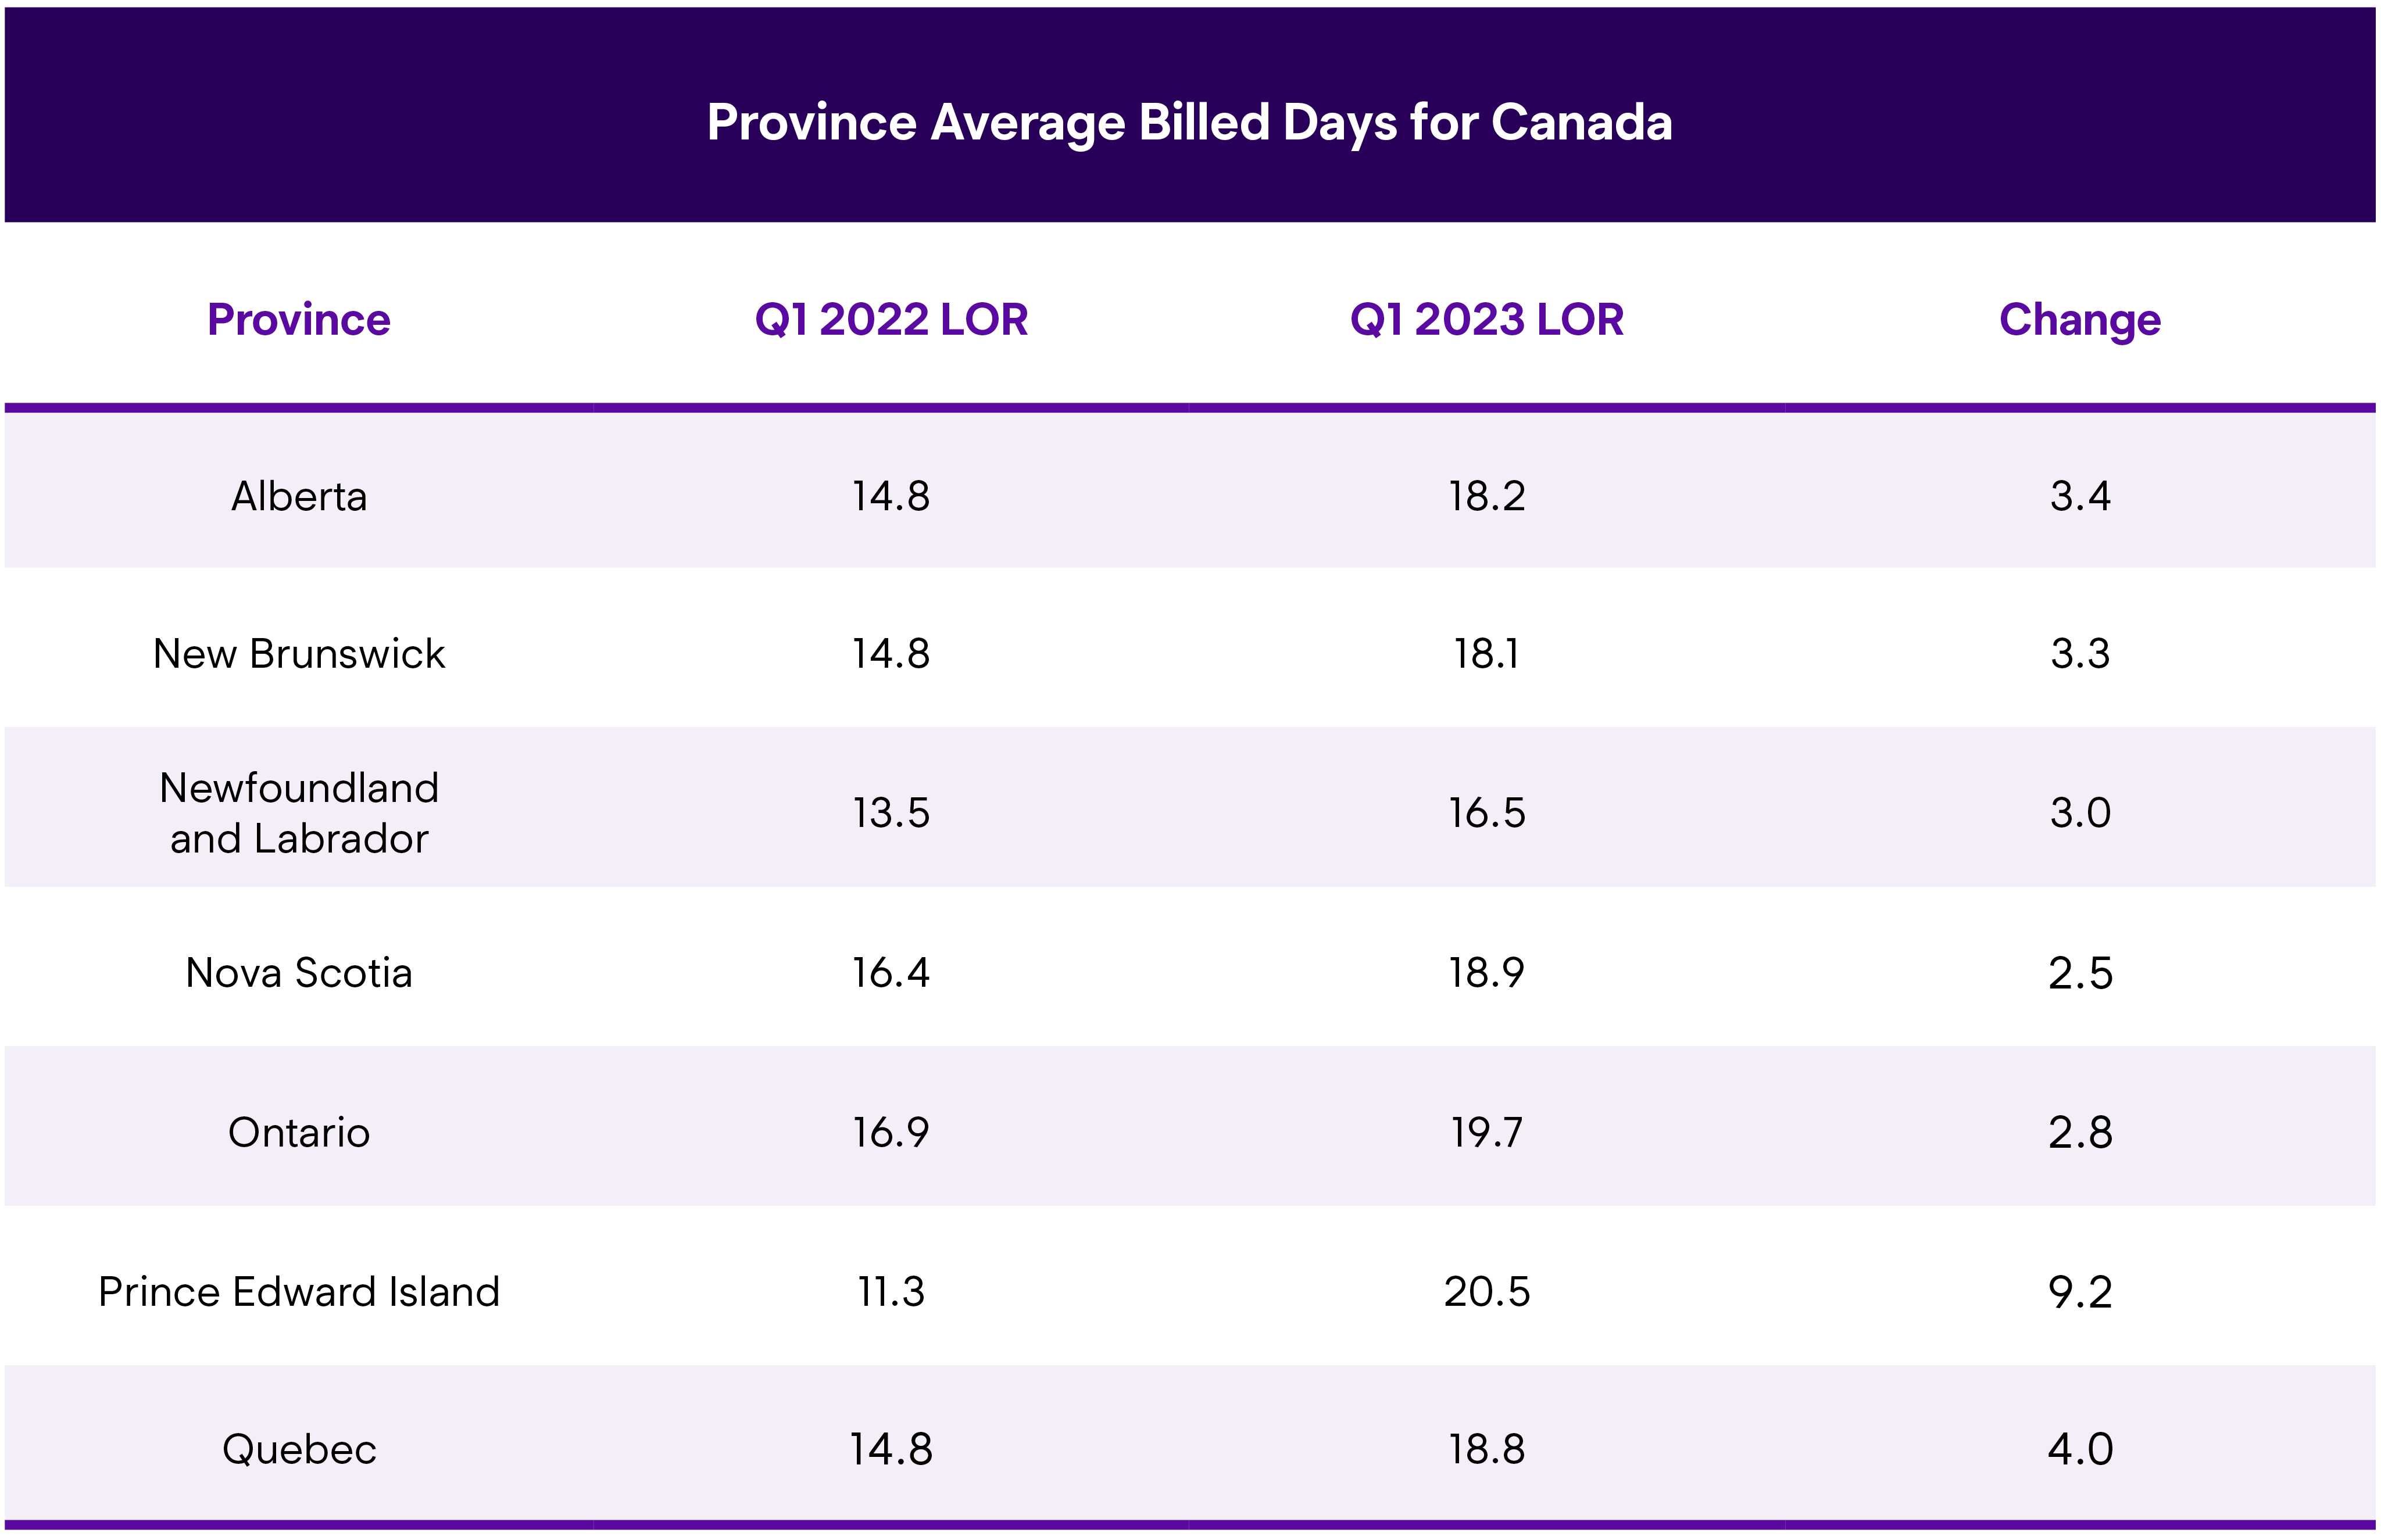
PEI had the highest LOR at 20.5 days, reflecting an increase of 9.2 days compared to Q1 2022. Ontario wasn’t far behind at 19.7 days. Nova Scotia followed at 18.9 days, Quebec was 18.8 days, Alberta 18.2, and New Brunswick 18.1. Newfoundland & Labrador was the only outlier at 16.5 days overall.
With the Canadian results experiencing the same trends as the U.S., we wanted to offer some insights south of the border. John Yoswick, Editor of the weekly CRASH Network newsletter in the U.S., shared that the national average backlog of work at U.S. shops set another record-high in January, reaching 5.8 weeks last month, up from 5.3 weeks in the last quarter of 2022. For the first time since they began tracking backlogs in 2017, fully 60% of shops in January were scheduling work four or more weeks into the future. Of the more than 700 shops that responded to the survey, almost 9 in 10 (87%) were scheduling two weeks or more into the future, and only eight shops (1.1%) said they currently had no backlog and could schedule work immediately.
Ryan Mandell, Director of Claims Performance for Mitchell International, shared: “Canada experienced an increase in parts availability through the aftermarket channel with overall alternative parts utilization increasing from 25.32% in Q1 2022 to 27.71% in Q1 2023.”
“The refinish process is increasingly lengthening in Canada with the average number of refinish hours increasing to 8.55 from 8.53, and average number of blend lines increasing from 0.57 to 0.6. While these numbers may seem minute at best, we can expect these numbers to continue to increase as supplements develop over the course of the next several months,” Mandell added. “Similar to the U.S., Canada saw a decline in the frequency of air bag deployment for repairable vehicles from 1.21% to 1.12%; however, the frequency of repairable vehicles classified as non-drivable increased significantly from 14.73% in Q1 2022 to 15.99% in Q1 2023.”
Mandell also offered: “Contrary to what we saw in the U.S., Canadian front-end impact frequency actually increased from 34.63% to 35.09% in the first quarter.”
Drivable
The drivable LOR for Q1 2023 was 12.7 days, a comparatively more modest increase at 1.8 days higher than Q1 2022. Ontario was tops at 14.4 days, which was a 1.9-day increase year-over-year. PEI was next-highest at 13.4 days, but that was fueled by a 6.8-day increase from Q1 2022. New Brunswick and Quebec had the lowest drivable LOR of 11.0 days, which represented a 1.7-day increase for both provinces.
Non-Drivable
Much of Canada’s overall 3.0-day increase came from rentals associated with non-drivable claims. Non-drivable LOR in Q1 2023 was 32.6 days, a 6.8- day increase from Q1 2022. This comes on top of the increase of 8.3 days Canada saw comparing Q1 2022 against Q1 2021.
PEI had the highest non-drivable LOR with 40.4 days, a 13.5-day increase from Q1 2022. Nova Scotia followed at 36.1 days, and Ontario and Alberta weren’t far behind at 35.0 and 34.7 days respectively. Ontario’s results reflect a 7.3-day increase over Q1 2022, and Alberta is up 9.2 days. Quebec had the lowest non-drivable LOR at 25.0 days, which still represents a 5.4-day increase from Q1 2022.
Total Loss Claims
Total Loss LOR in Q1 2023 was 26.0 says, a 5.1-day jump from Q1 2022. Nova Scotia and PEI both came in at 28.0 days, 11.4- and 14.0-day increases respectively. Alberta total loss LOR was 26.6 days with Ontario close behind at 26.5 days.
Data excludes the private carrier provinces of British Columbia, Manitoba and Saskatchewan.
Summary
The results for the first quarter of this year are significant, with LOR exacerbated by supply chain disruptions, parts delays, collision repair backlogs, and technician shortages. With the complexity of vehicle repairs only increasing, for both internal combustion engine (ICE) and battery electric vehicles (BEV) models, the entire industry must play a part in ensuring all collision-related businesses are aligned—not just for procedural solutions, but to ensure our mutual customers receive safe and proper repairs, an excellent experience, and peace of mind.
Enterprise is committed to partnering with insurers, repairers, and suppliers on each one of these issues. Through foundational support provided by the Enterprise Holdings Foundation, Enterprise is spearheading the Collision Engineering Program, designed to attract and develop entry-level talent to fill essential roles within the collision repair industry. Enterprise is thrilled to expand its longtime partnership with Ford Motor Company, through its philanthropic arm, the Ford Fund, to expand the program and help address this ongoing industry challenge. For more information, visit beacollisionengineer.com.