

Average Length of Rental for Repairable Vehicles: Q4 2022
The quarterly LOR summary is produced by Enterprise Rent-A-Car. Through its ARMS® Automotive Suite of Products, Enterprise provides collision repair facilities with free cycle time reporting with market comparisons, free text/email capability to update their customers on vehicle repair status, and online reservations. More information is available at armsautosuite.com.
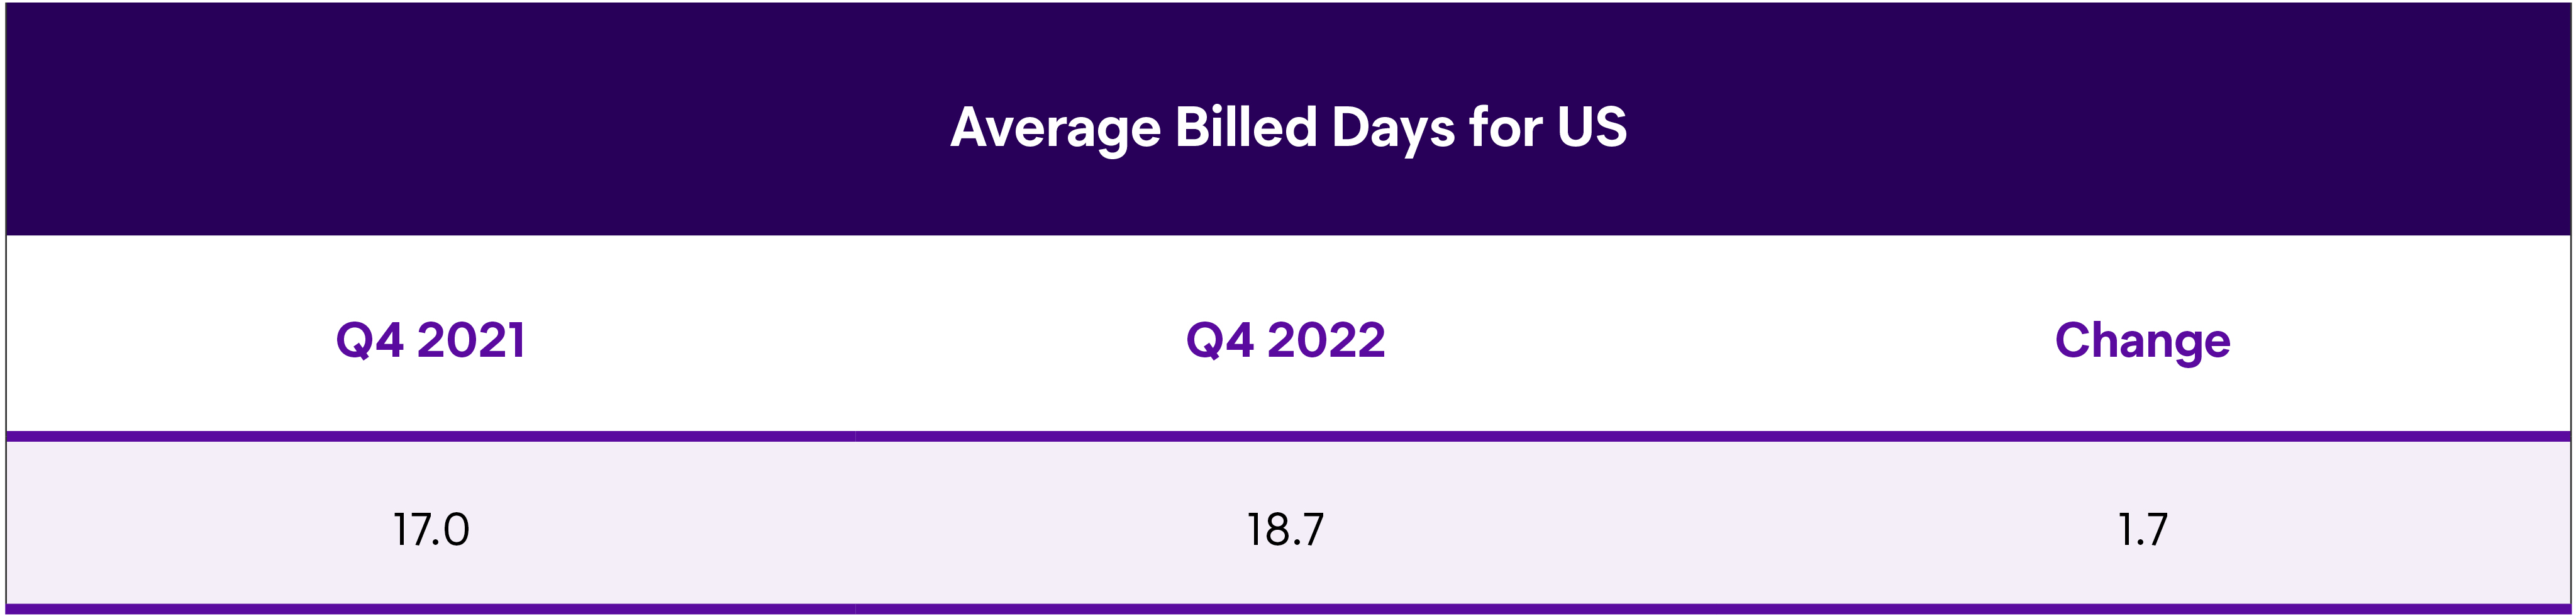
U.S. Length of Rental—Q4 2022
As we have previously observed, historical trending of Length of Rental (LOR) has shown a fourth-quarter increase over the third quarter—usually brought about by winter weather, animal accidents and holiday travel.
In Q4 2022, this trend continued. LOR was 18.7 days in Q4 2022, up one half-day from Q3 2022. When compared to Q4 2021 results, LOR is up 1.7 days. It is an increase, but not as high as Q3 2022’s results which showed a 3-day increase year over year, and less than the 3.9-day increase observed in Q4 2021 compared to Q4 2020.
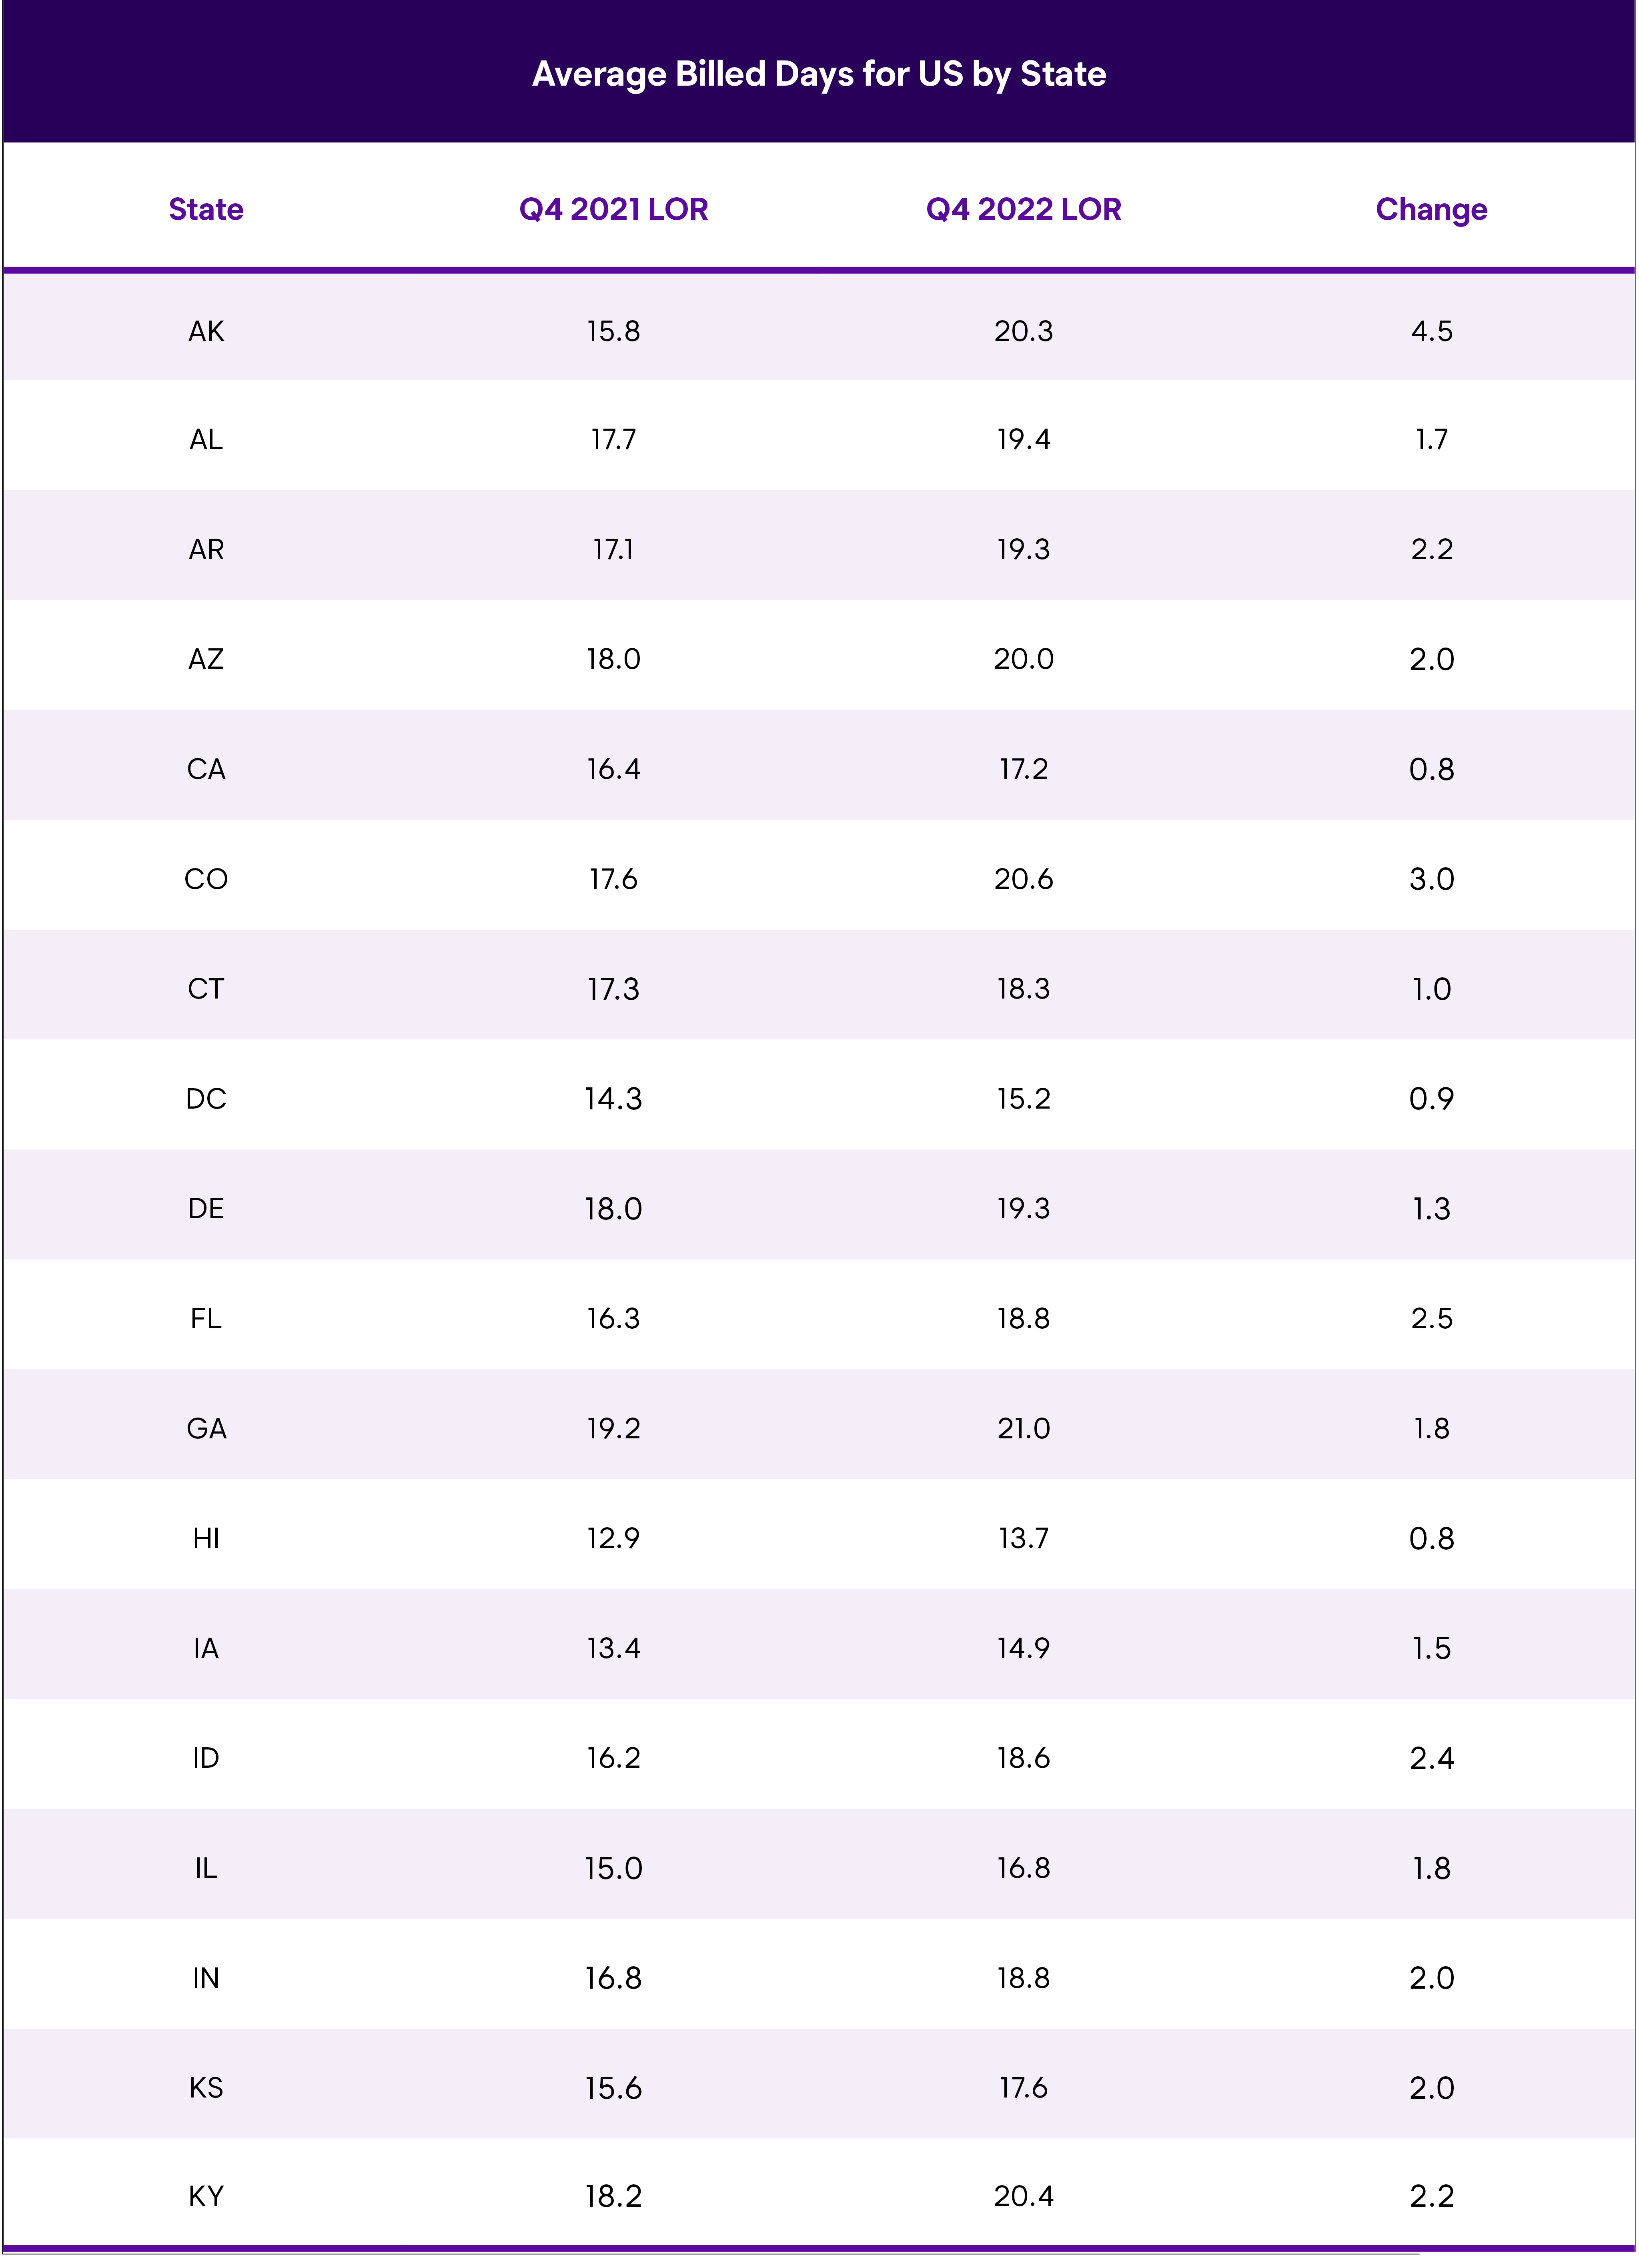
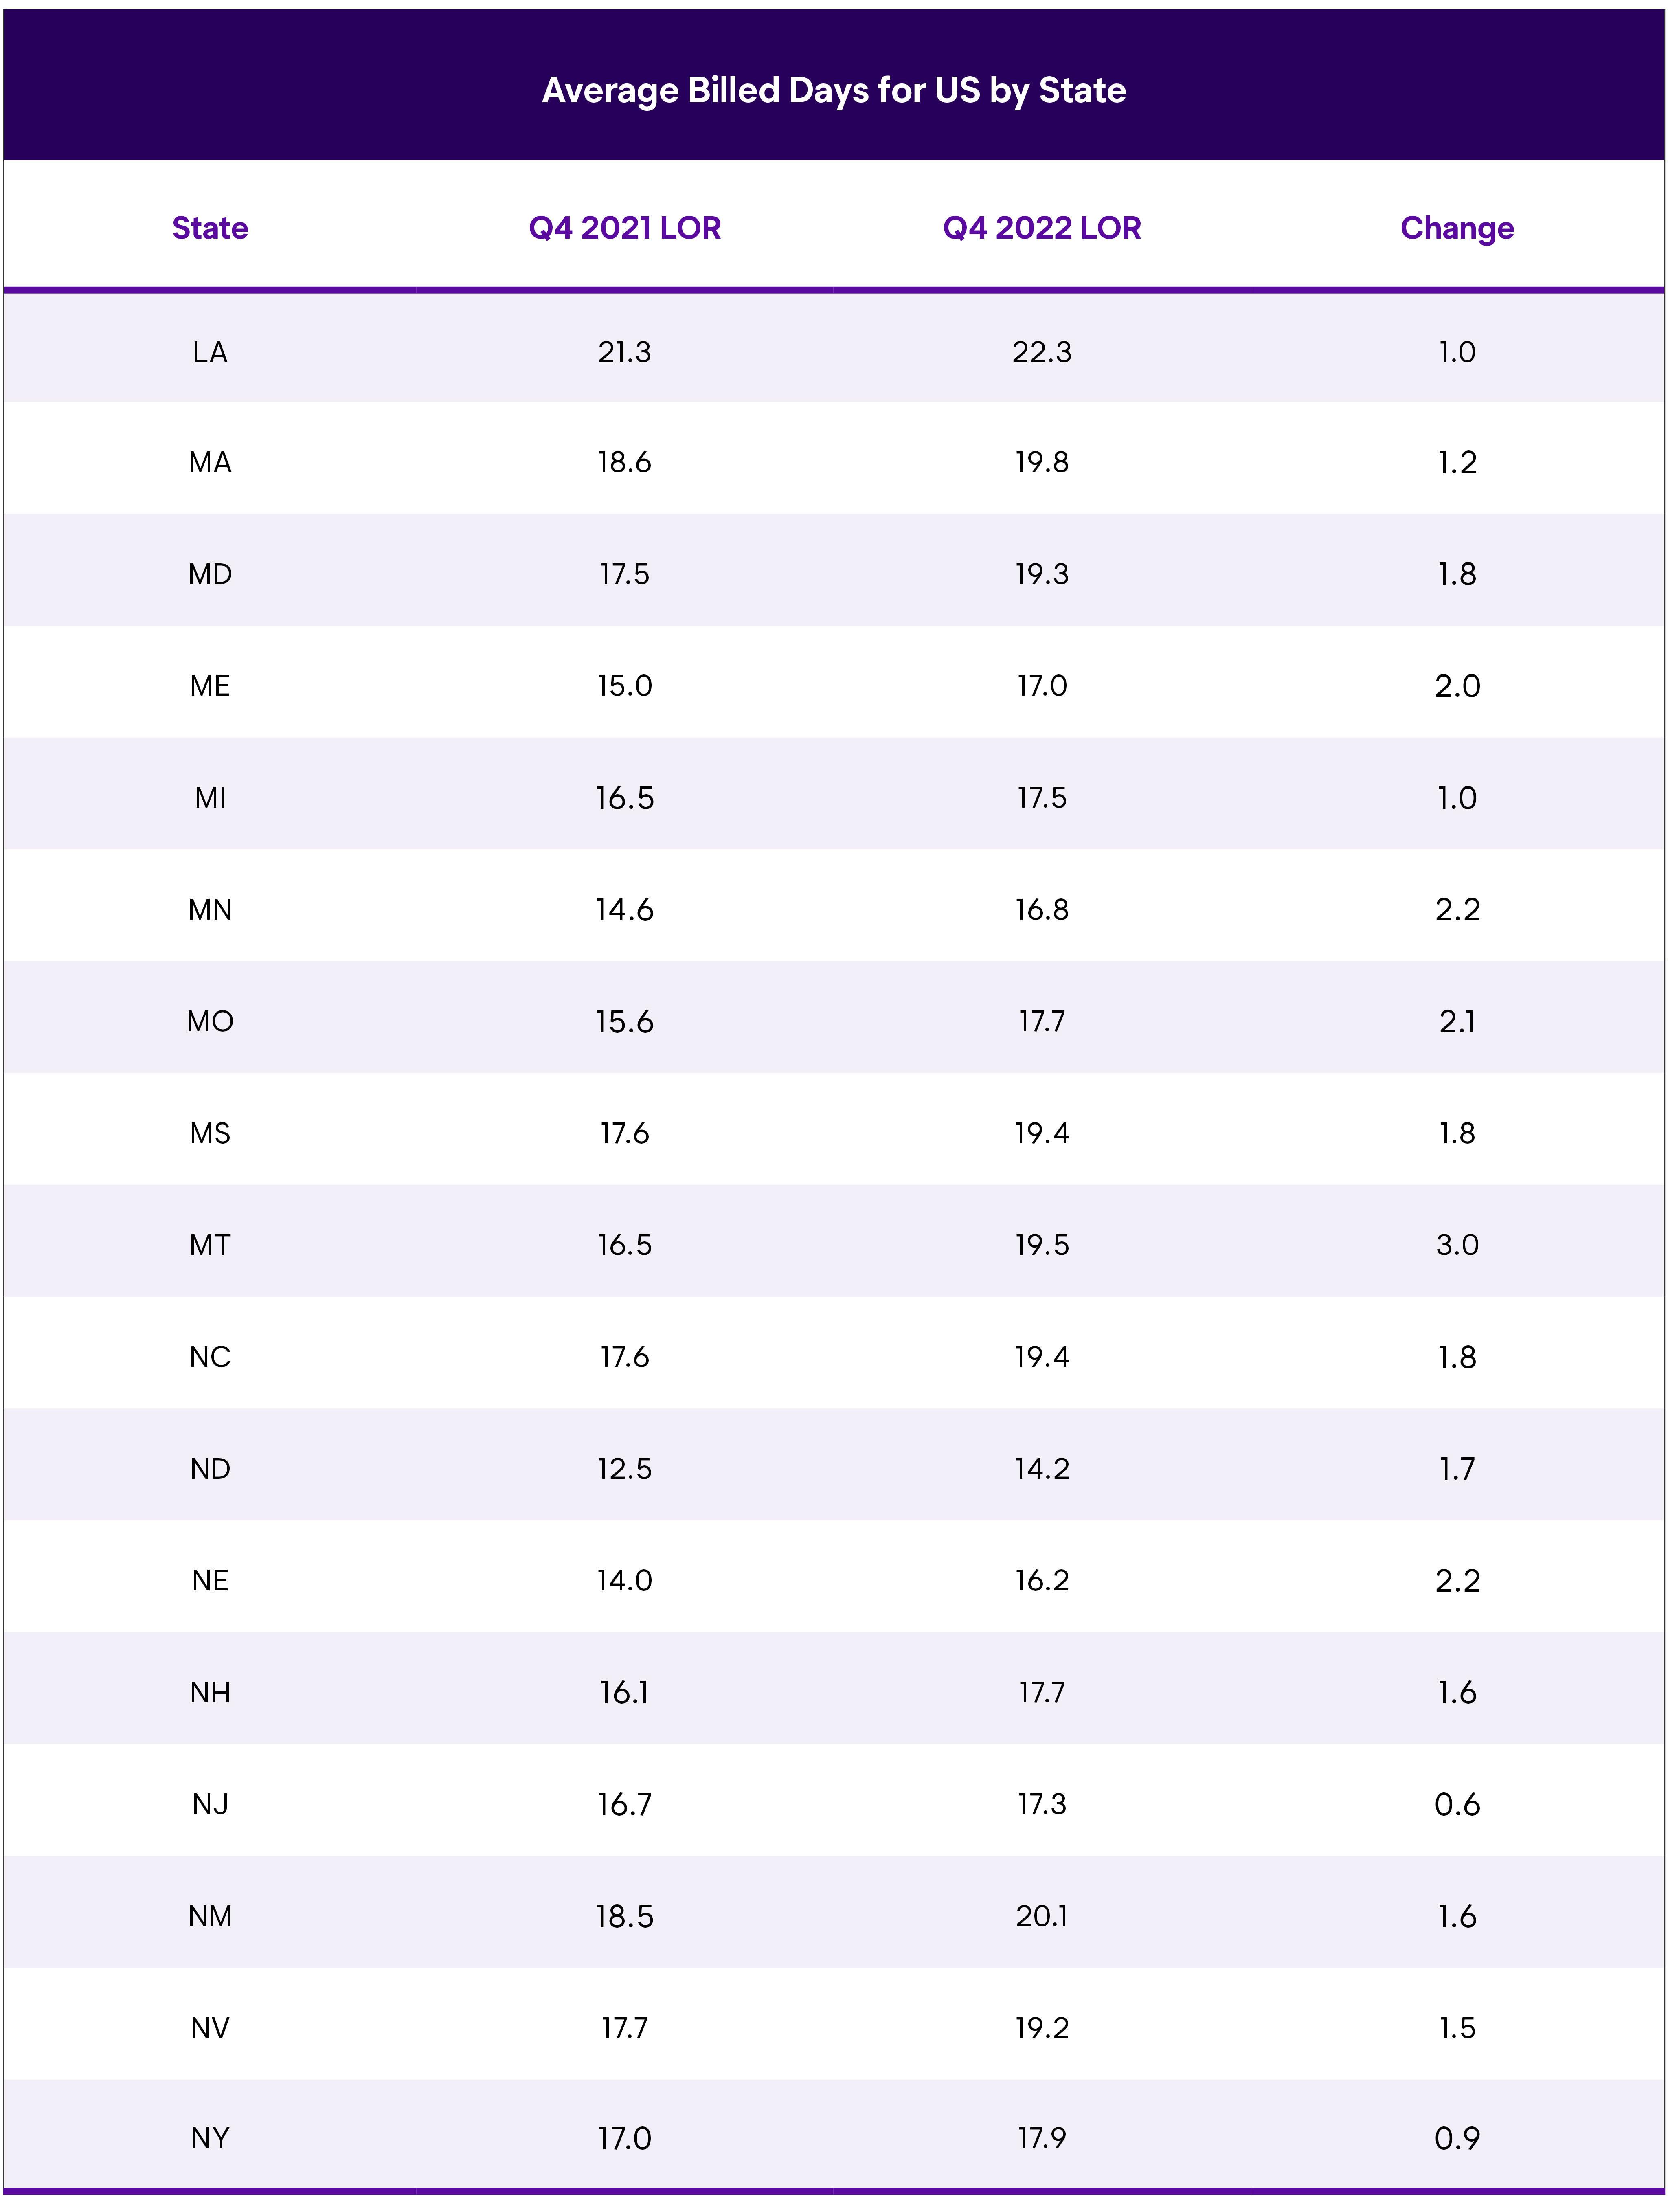
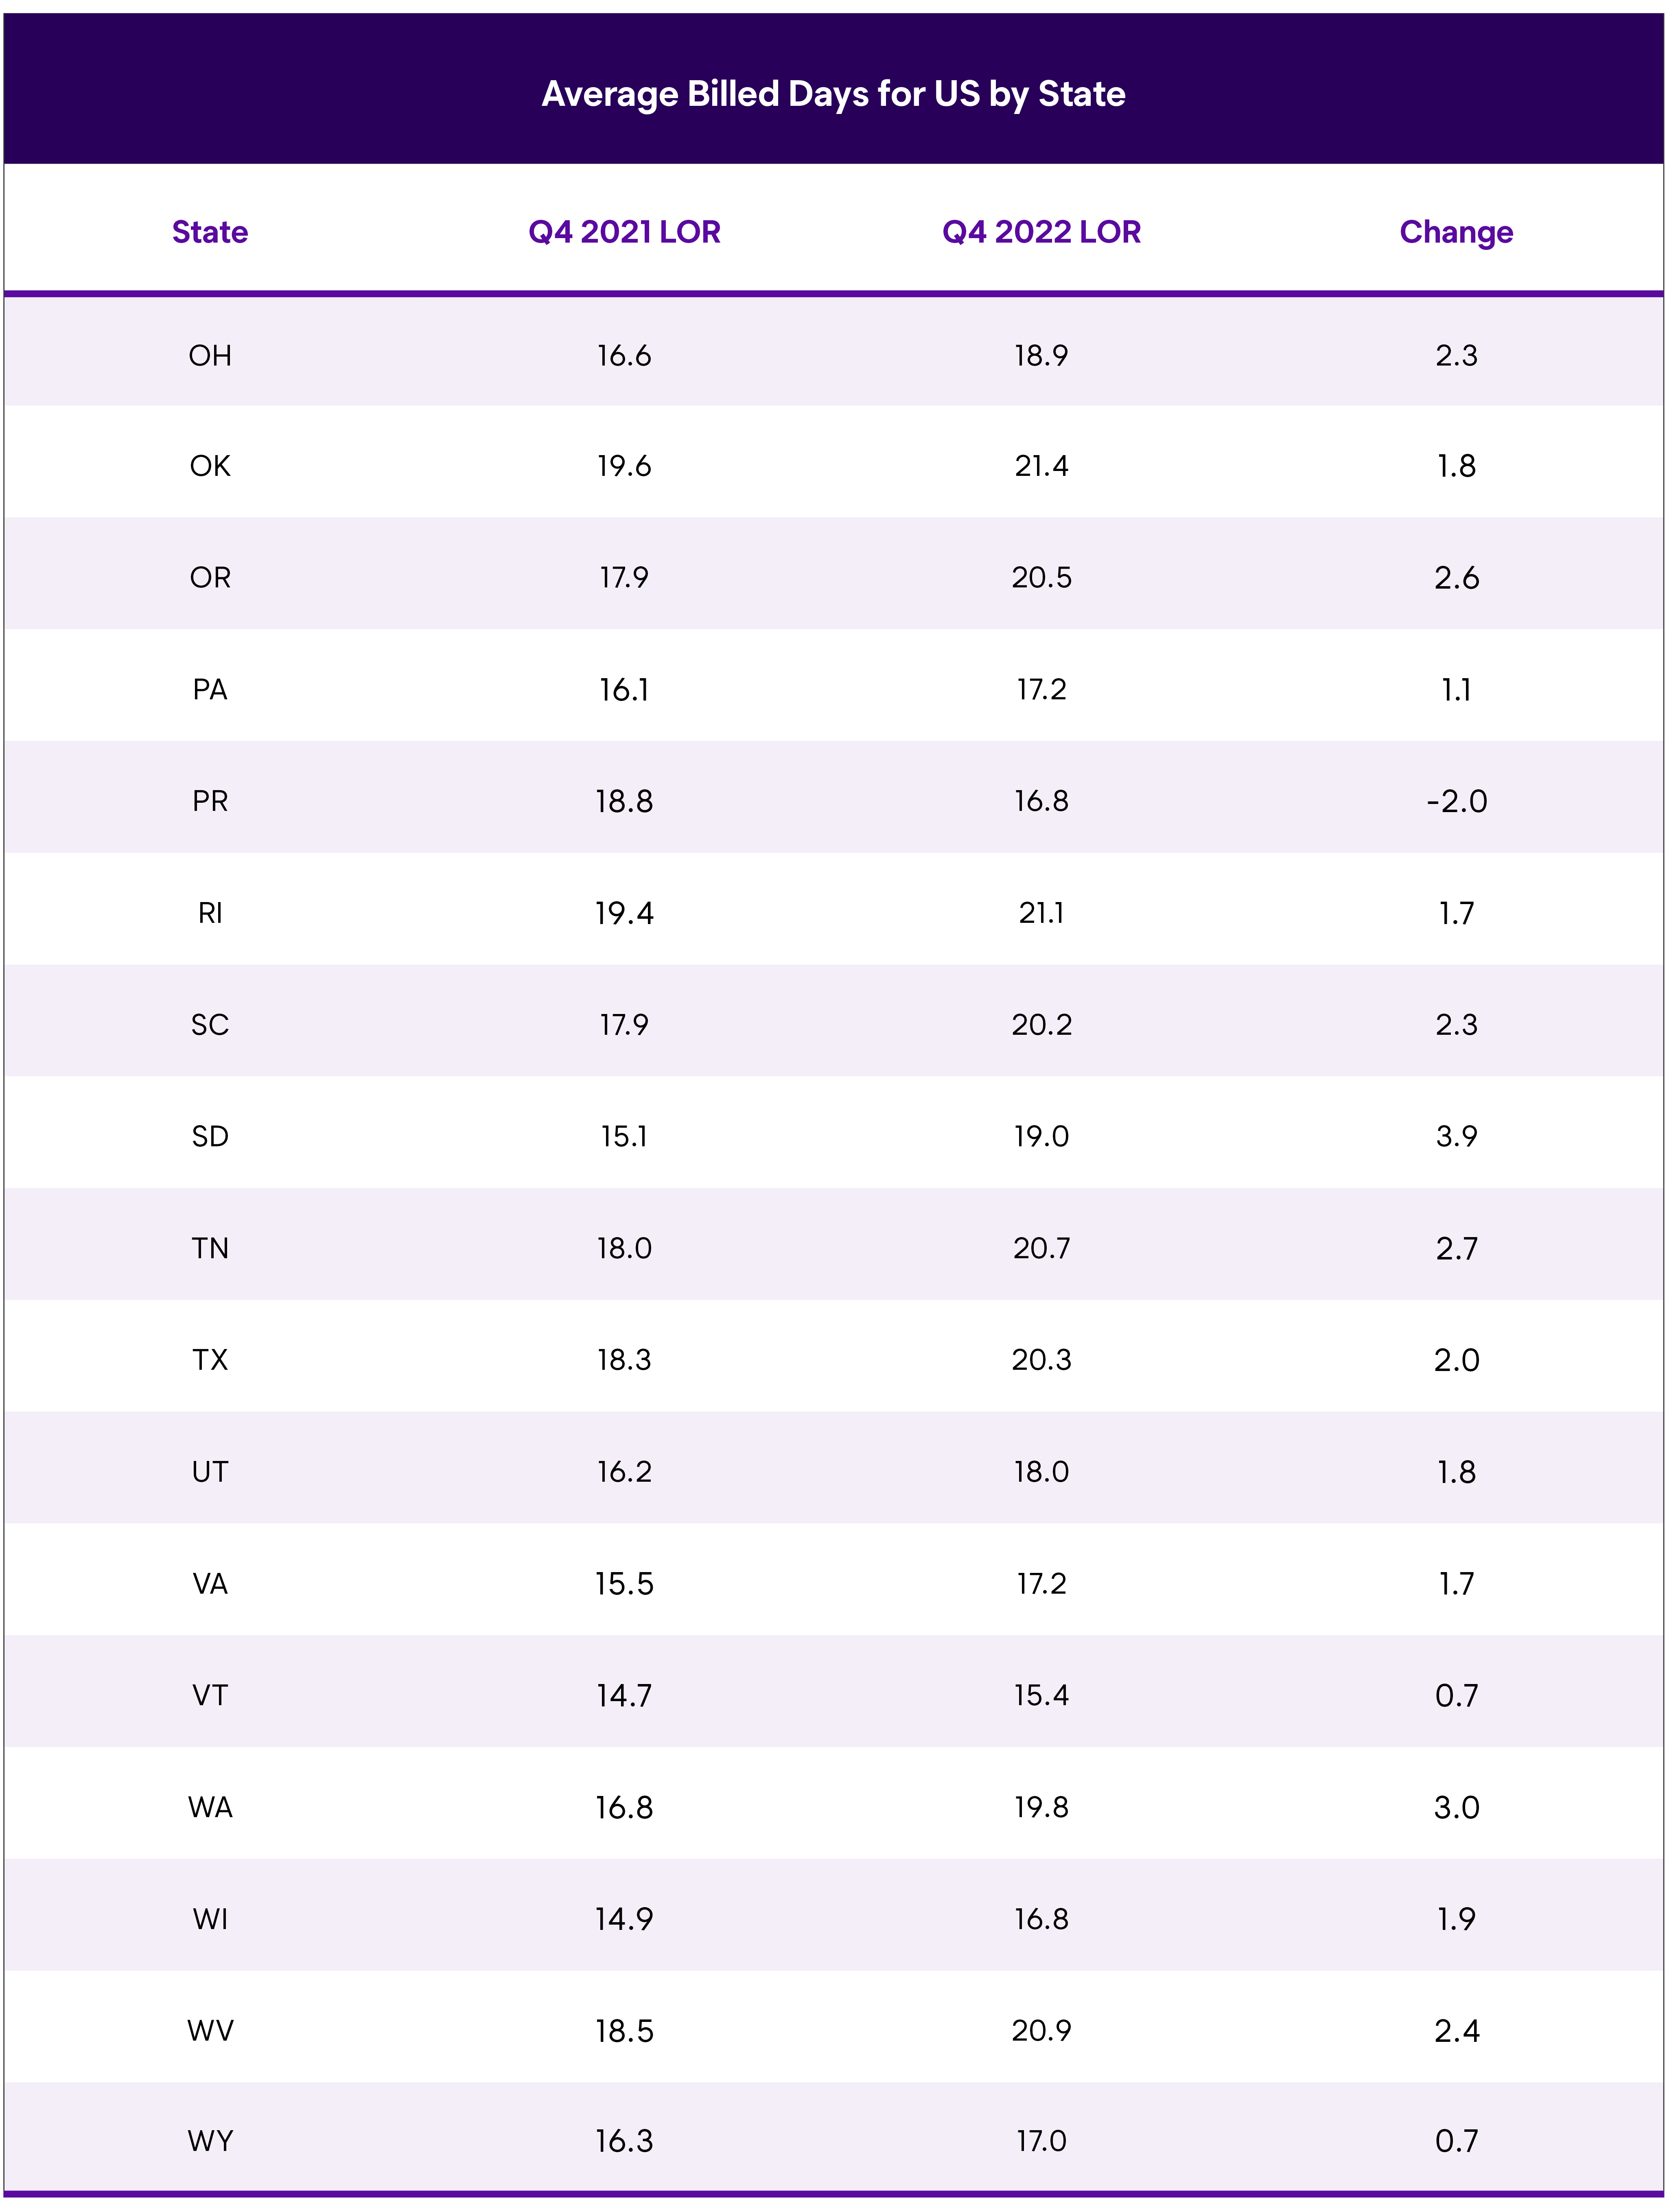
U.S. Average Length of Rental (LOR) By State—Q4 2022
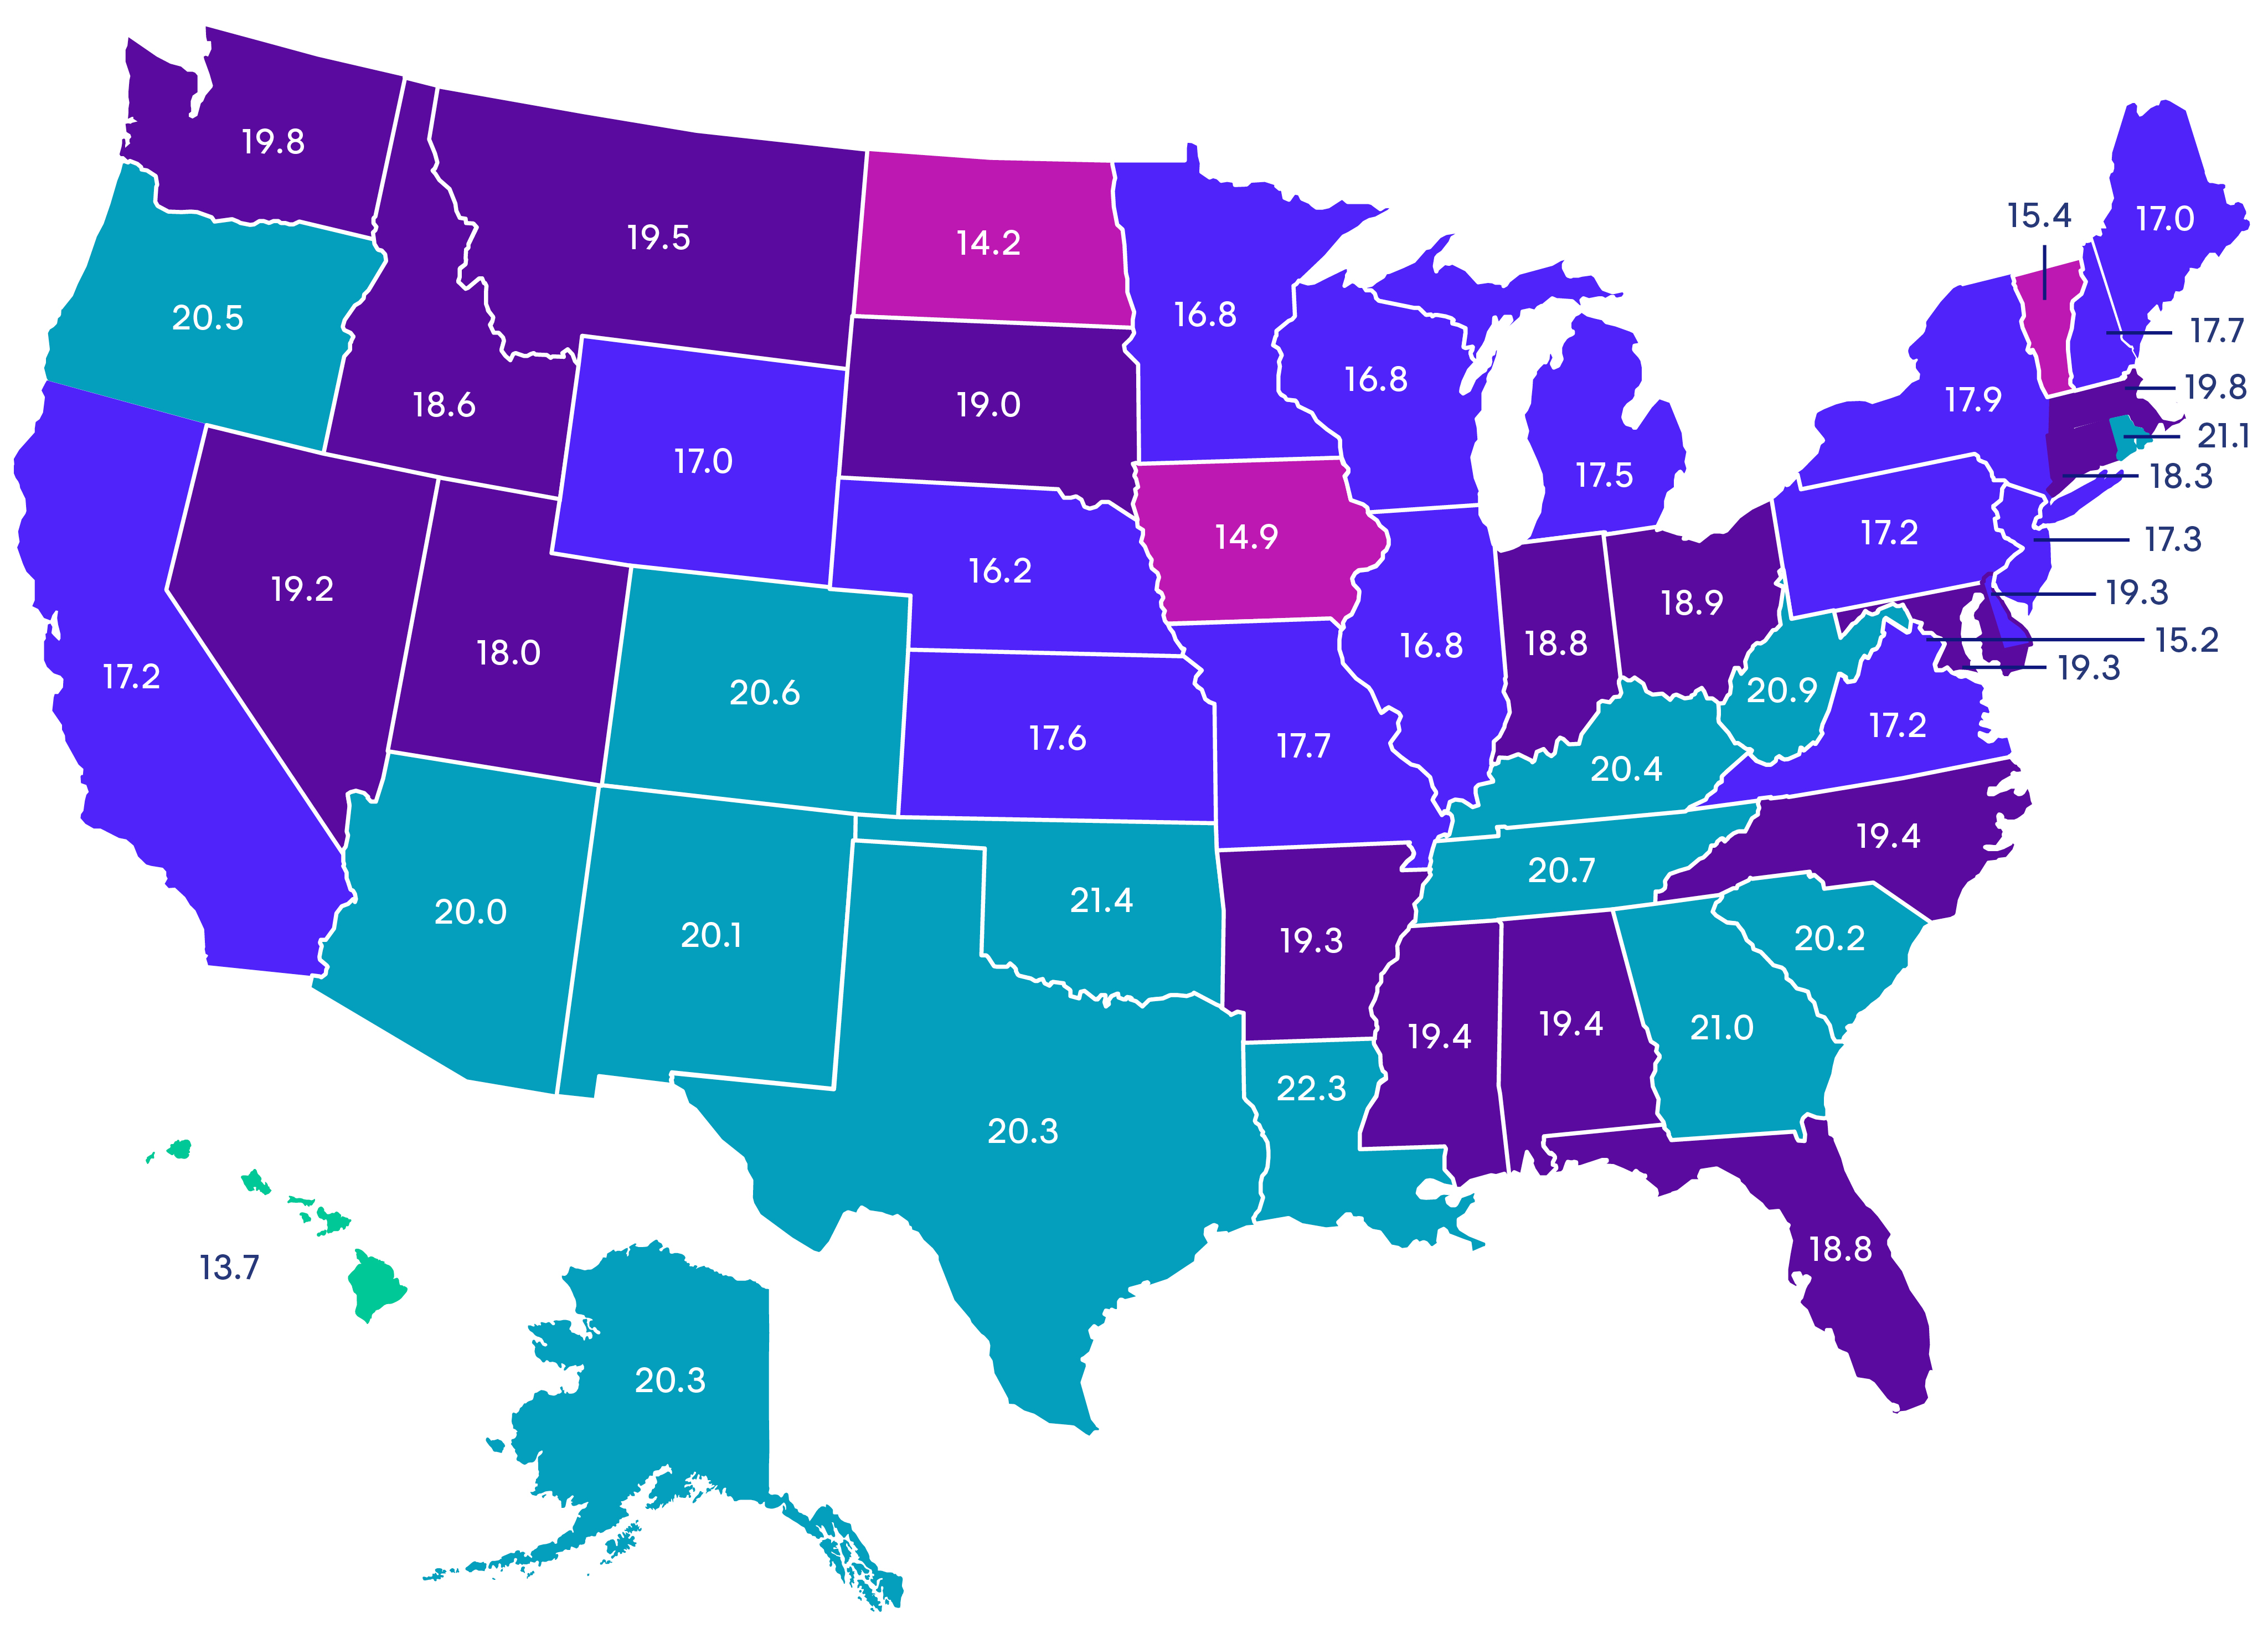
Excludes total losses.
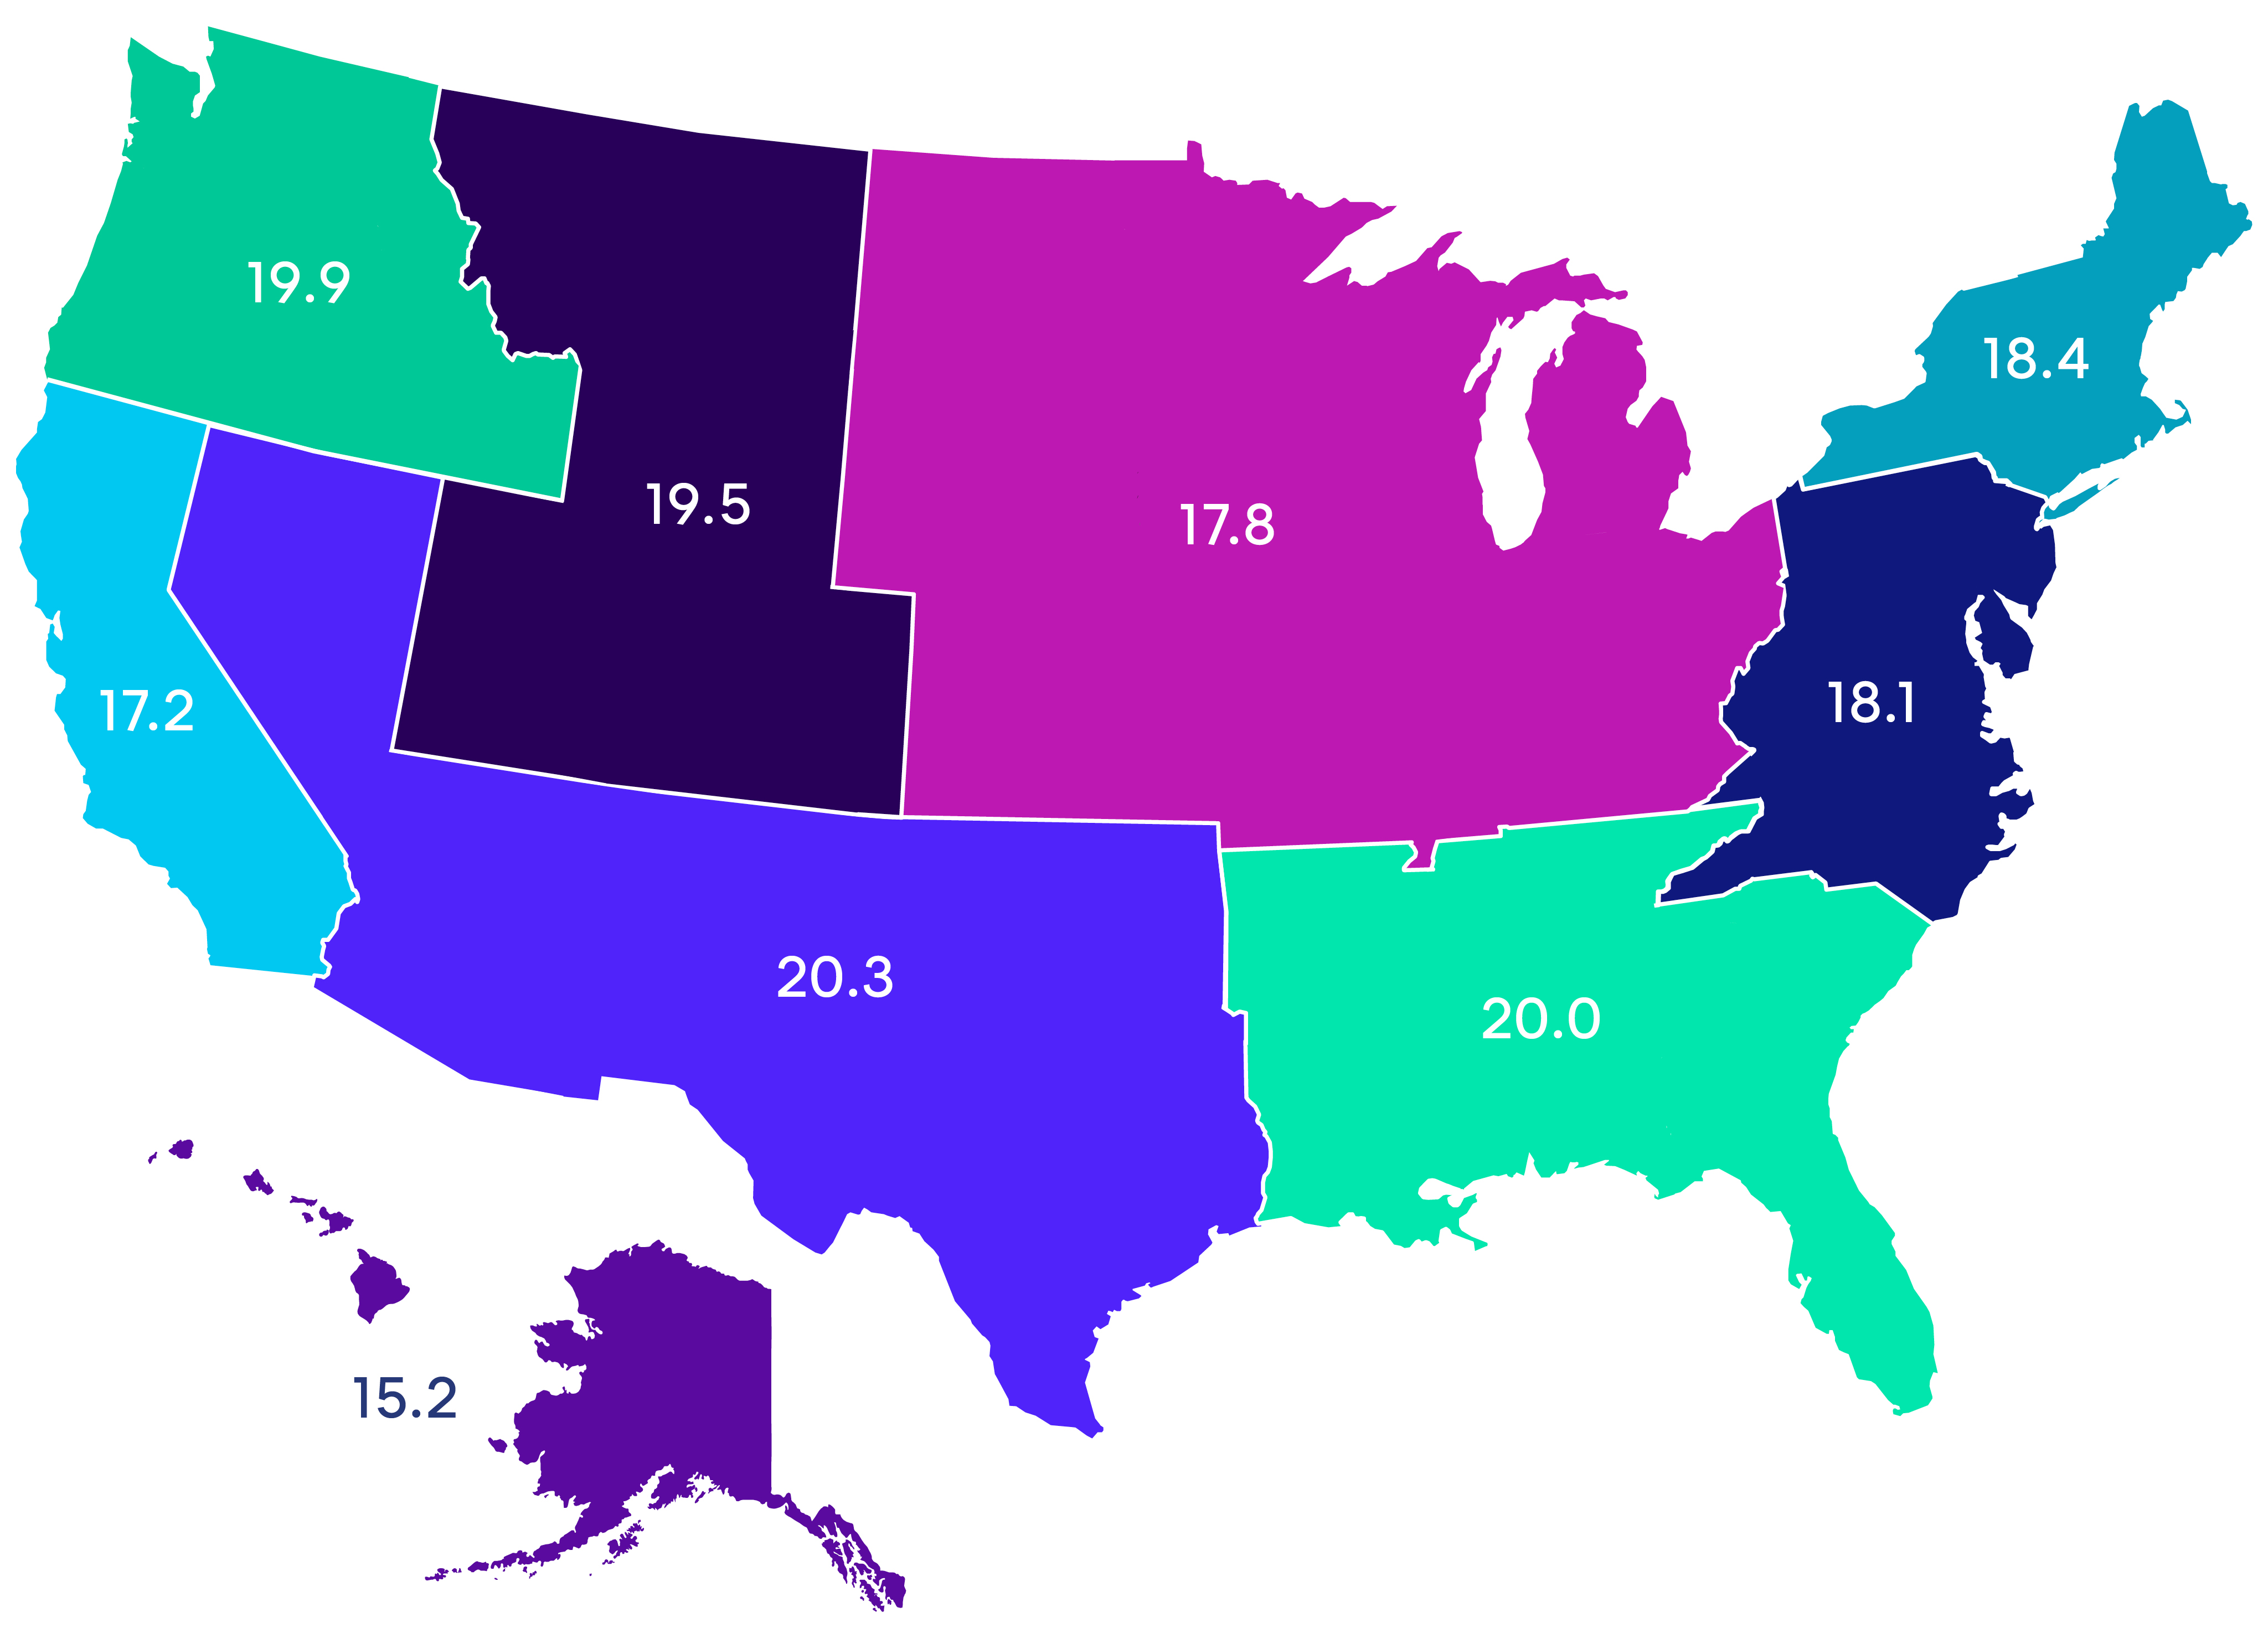
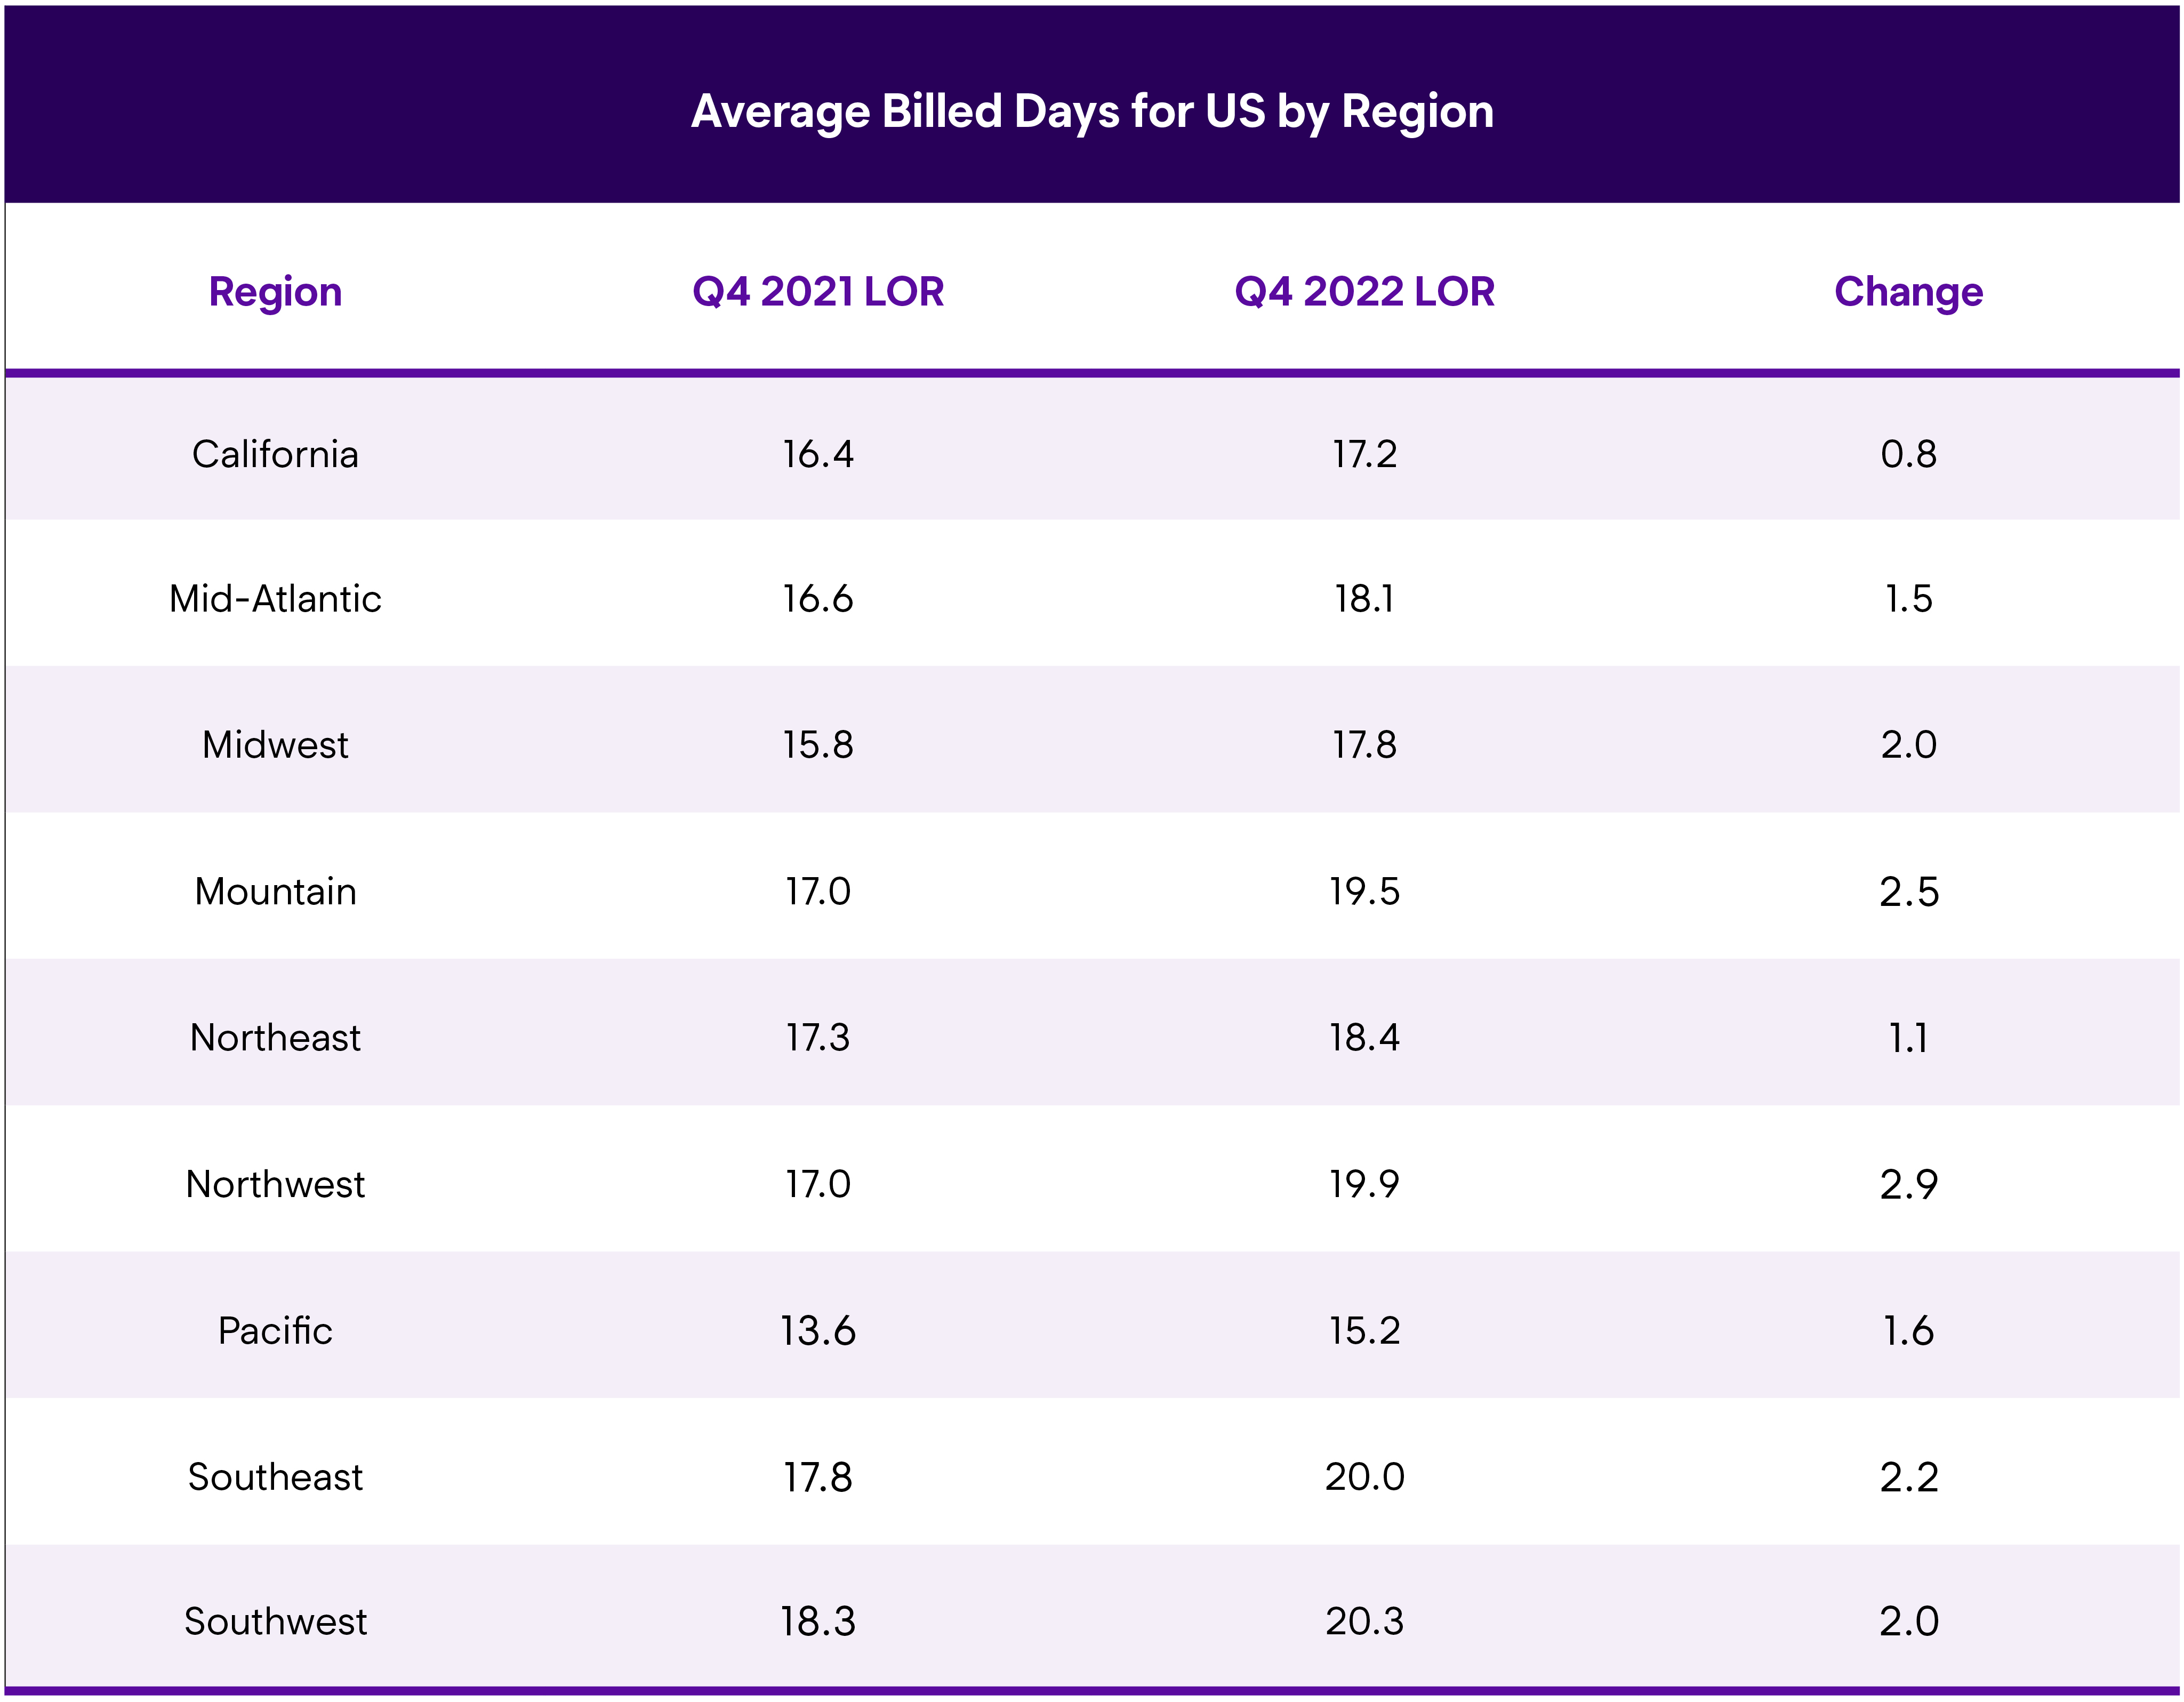
U.S. Average Length of Rental (LOR) By Region—Q4 2022
Overall
Louisiana recorded the highest overall LOR of any state at 22.3 days, a one-day increase over their Q4 2021 results, followed by Oklahoma (21.4), Rhode Island (21.1), and Georgia (21.0). Ten additional states saw LOR above 20 days. The lowest LOR in the country was Hawaii at 13.7 days, still an increase of 0.8 over Q4 2021. Alaska (20.3) saw the highest year-over-year increase—4.5 days. Colorado, Montana, South Dakota and Washington also saw increases of 3 days or more. Every state saw an increase year over year, but New Jersey, Vermont, Wyoming, Hawaii, California, and New York were less than one full day.
Parts issues, technician staffing, and more complex repairs continue to be referenced by industry experts as factors in longer repair times. John Yoswick, Editor of the weekly CRASH Network newsletter, remarked: “The overall trends in LOR match up with what we saw happen with the backlog of work that repairers reported in our Q4 survey. While the national average backlog remained at 4.8 weeks, unchanged from the record high in Q3, there was another jump in the percentage of shops with the largest backlogs. A record 25% of shops were reporting eight weeks or more of work scheduled. For comparison, in pre-pandemic Q4 2019, just 6.4% of shops had backlogs of even just four weeks or more, and the national average was under two weeks.”
He continued: “Some of the state changes in LOR sync up with what we saw in terms of shops’ backlog of work in Q4. Colorado, Montana, South Dakota and Washington, where Q4 LOR was up by three days or more, are all in regions where we saw Q4 backlogs increase by a half-week or more. These regions were also among those with the highest average Q4 backlog—5.5 weeks or more—compared to the three Sunbelt regions where average backlogs were between 3.5 and 4.9 weeks.”
Greg Horn, PartsTrader’s Chief Innovation Officer who oversees their data analytics department, also commented on Q4 data trends: “At PartsTrader, we processed close to $2 billion in parts transactions in 2022 and track delivery days quoted in our platform. We measure parts delivery days by measuring the median plus two standard deviations to capture the parts that are driving collision repair delays. While delays in parts is only one factor in longer repair times, it is a major one. Our data shows that Q4 2022 median delivery days for parts were up by 0.4 days over Q3 2022, which tracks with Enterprise’s LOR reporting. Similarly, when we compared the Q4 2022 delivery days for parts to Q4 2021, we measured a nearly identical increase of 1.5 days. This would indicate a strong correlation between parts fulfillment and length of rental increases.”
Ryan Mandell, Director of Claims Performance for Mitchell International, shared some relevant data: “The average vehicle age in Q4 2022 was older than in Q4 2021 (7.34 years old compared to 7.01 years old). Average severity is already nearing Q4 2021 numbers at $4,015 (compared to $4,068) with approximately 40% of supplements still outstanding. Average total labor cost has already eclipsed the Q4 2021 number, increasing from $1,586 to $1,593. Again, important to keep in mind that as supplements are taken into account the Q4 2022 number will continue to rise.”
Drivable
LOR associated with drivable claims was 16.2 days in Q4 2022, also a 1.7 day increase from Q4 2021, and only 6/10ths of a day higher than Q3 2022.
Rhode Island recorded the highest drivable LOR at 19.3 days, followed by Louisiana (18.9), Georgia (18.7), Oklahoma (18.7), Tennessee (18.2) and Oregon (18.1). The highest year-over-year increase was in Alaska, where LOR jumped 5.1 days higher than Q4 2021—almost two times greater than the next highest year-over-year increase seen in Washington (+2.8).
The lowest drivable LOR was North Dakota at 11.3 days, followed by Hawaii (11.8), Vermont (12.6), Iowa (12.7) and DC (12.9). Wyoming saw only a 0.2-day increase; California, Louisiana, Michigan, Vermont and Washington DC all had increases under one day.
Non-Drivable
For rentals associated with non-drivable claims, LOR was 27.1 days in Q4 2022, a 2.8-day increase from Q4 2021 (24.3), but almost static compared to Q3 2022 (up 0.1 day).
Louisiana had the highest non-drivable LOR at 33.2 days, a 3.7-day increase from Q4 2021. An additional nine states all had non-drivable LOR higher than 30 days, followed by eight more states with LOR above 29 days. South Dakota (30.6) saw the highest increase with LOR jumping eight days higher than Q4 2021 (22.6). Alaska, Colorado, Maine, Montana and Washington saw non-drive increases greater than 5 days.
On the other end, Iowa and New York had the lowest non-drivable LOR at 23.0 days each, followed by Washington DC at 23.4. California, Hawaii, Massachusetts, New Jersey and Virginia had LORs under 25 days. Hawaii recorded the only decrease from the previous year’s quarter with results down 0.7 days.
Yoswick offered additional insights into the repair backlog: “Parts issues, workforce challenges and more harder-hit vehicles are also showing up in another increase in late 2022 in how many jobs shops say they have in-process relative to their typical workload. The 300+ shops responding to a CRASH Network survey in December had an average car count of 79 jobs per month and reported currently having 61 jobs in process, or the equivalent of 77% of their typical monthly volume. That level of work-in-process is up from 64% three months earlier.”
“It may not be surprising to see WIP (work in progress) rising even further in the fourth quarter, typically the busiest in many regions of the country, but most shops are still citing a lack of technicians and parts delays as the chief causes for the backlog of work,” added Yoswick. “Some shops also noted a higher than usual number of non-drivable repairs gumming up the works.”
“Non-drives are preventing regular scheduling, delaying repairs,” the manager of a smaller independent shop in Pennsylvania responding to CRASH Network’s survey said. “The last three out were each between $9,000 and $20,000 in damage.”
Regarding increases in non-drivable repairs, Mandell added: “Air bag deployments have reached the highest number ever recorded at 1.26%, up from 1.11% in Q4 2021.”
Total Loss Claims
LOR with totals was 18.2 days, a comparatively modest increase of 0.6 days from Q4 2021, and up 0.4 days from Q3 2022.
Hawaii, which saw some good results in other channels, actually had the highest total loss LOR at 24.6 days, an increase of 4.3 days (also the highest). The next highest were Oregon (21.4) and North Carolina (21.0). Minnesota saw a large increase as well, jumping 3.4 days, followed by Ohio with a 3.0-day increase.
On the other end, North Dakota saw a LOR of 14.9 days, followed by Vermont and Wisconsin at 15.9 days each. Seven additional states saw total loss LOR below 17 days. Twelve states, plus Washington DC, had decreases in total loss LOR compared to Q4 2021, led by Vermont (-2.4), Delaware (-1.4) and Rhode Island (-1.0).
Mandell also observed; “Total Loss frequency rose sharply in Q4 2022 to 18.2% (up from 17.9% in Q4 2021 and 16% in Q3 2022). A portion of this increase can be attributed to Hurricane Ian, which resulted in Total Loss frequency in Florida in Q4 2022 reaching 27.2% (up from 16.4% in Q4 2021 and 15.9% in Q3 2022).”
Canadian Average Length of Rental (LOR) By Province—Q4 2022
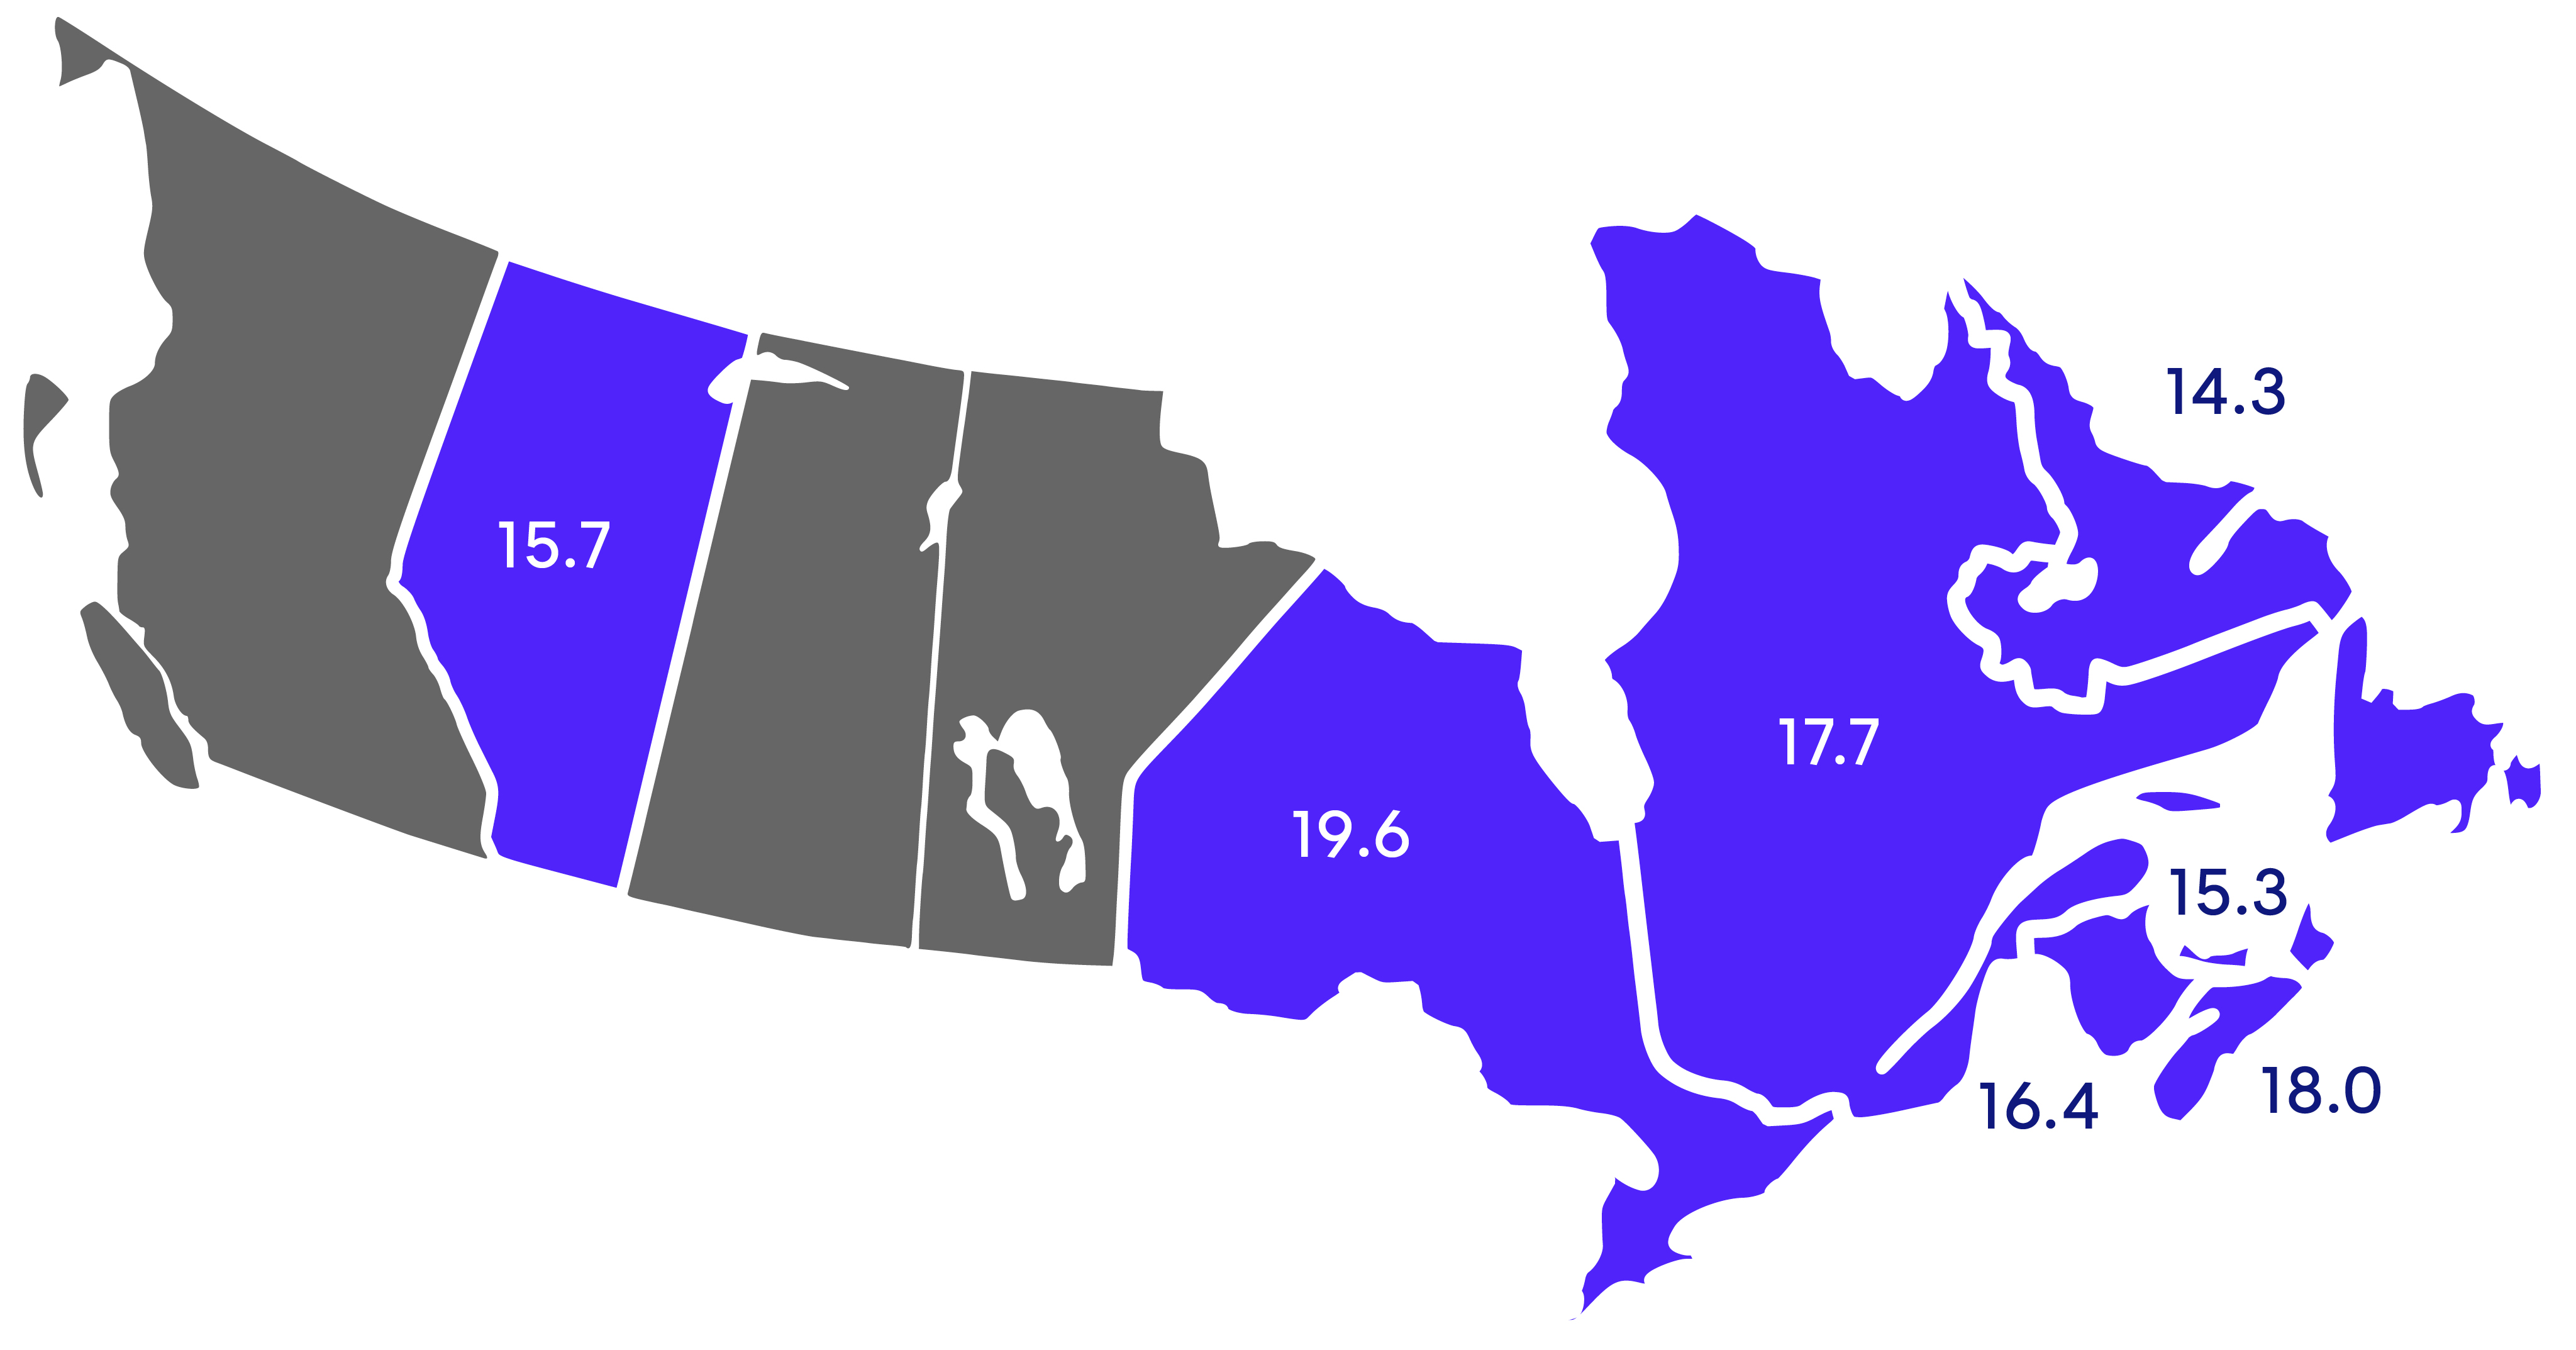
Excludes total losses.
Overall
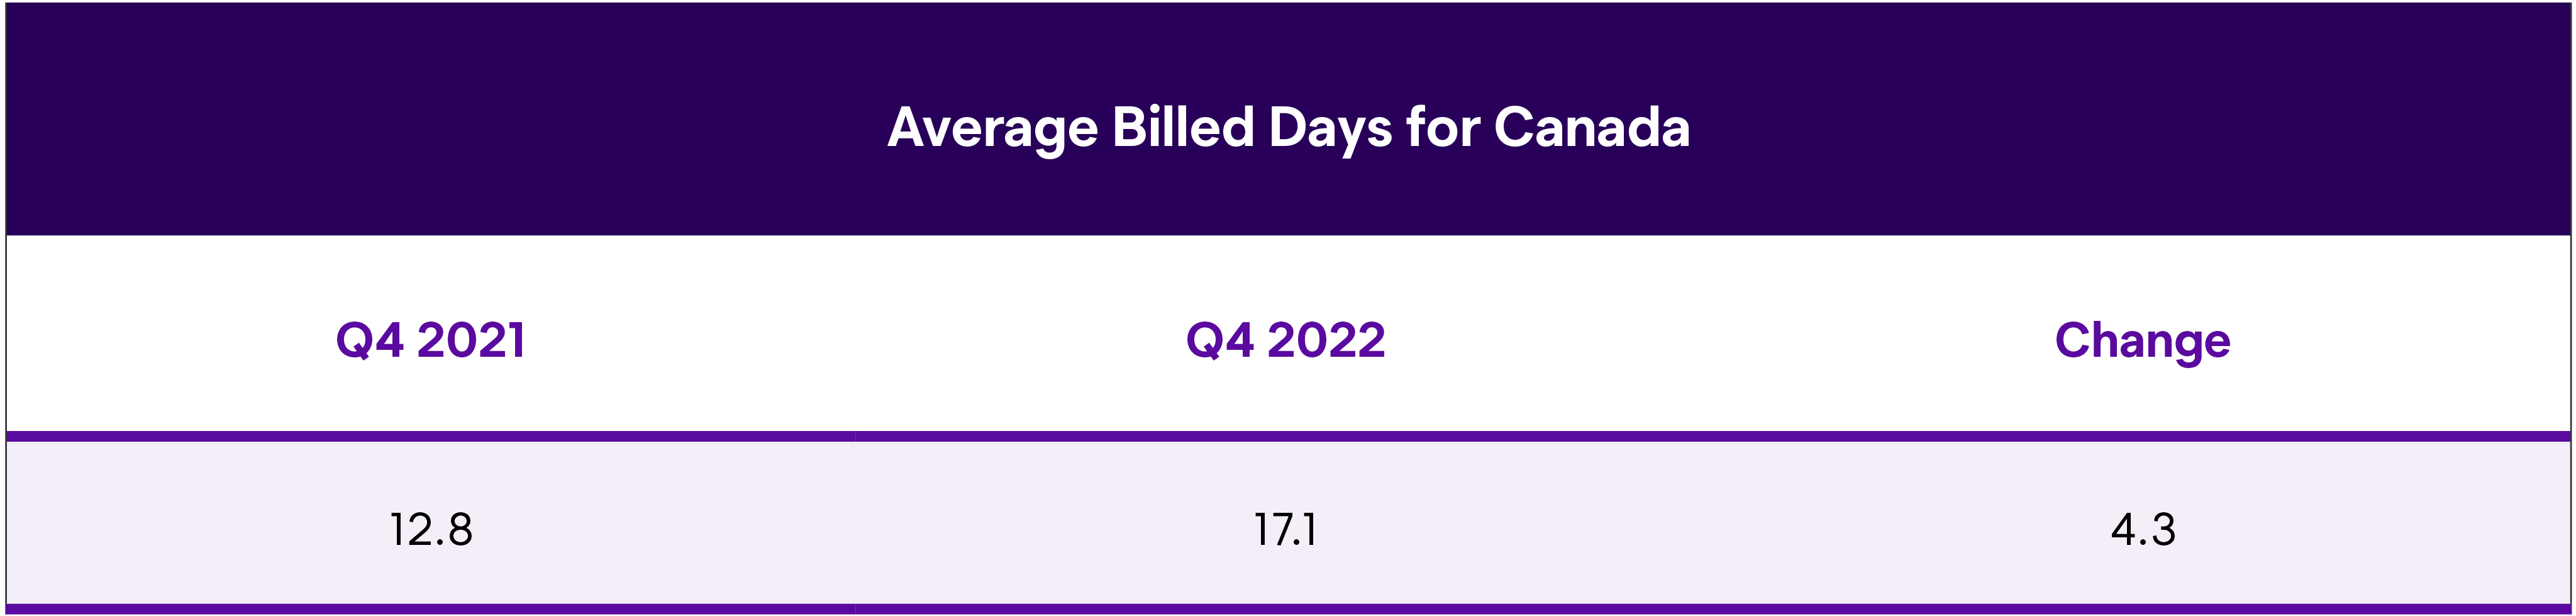
In the fourth quarter of 2022, Length of Rental (LOR) for collision-related claims was 17.1 days, an increase of 4.3 days from Q4 2021, and an increase of 0.6 days from Q3 2022. While the year-over-year increase is significant, the quarter-over-quarter increase is telling as this is in line with historical LOR trending from Q3 to Q4 of pre-pandemic years. For comparison purposes, overall LOR in the US was 18.7 days, though this was an increase of only 1.7 days above than Q4 2021.
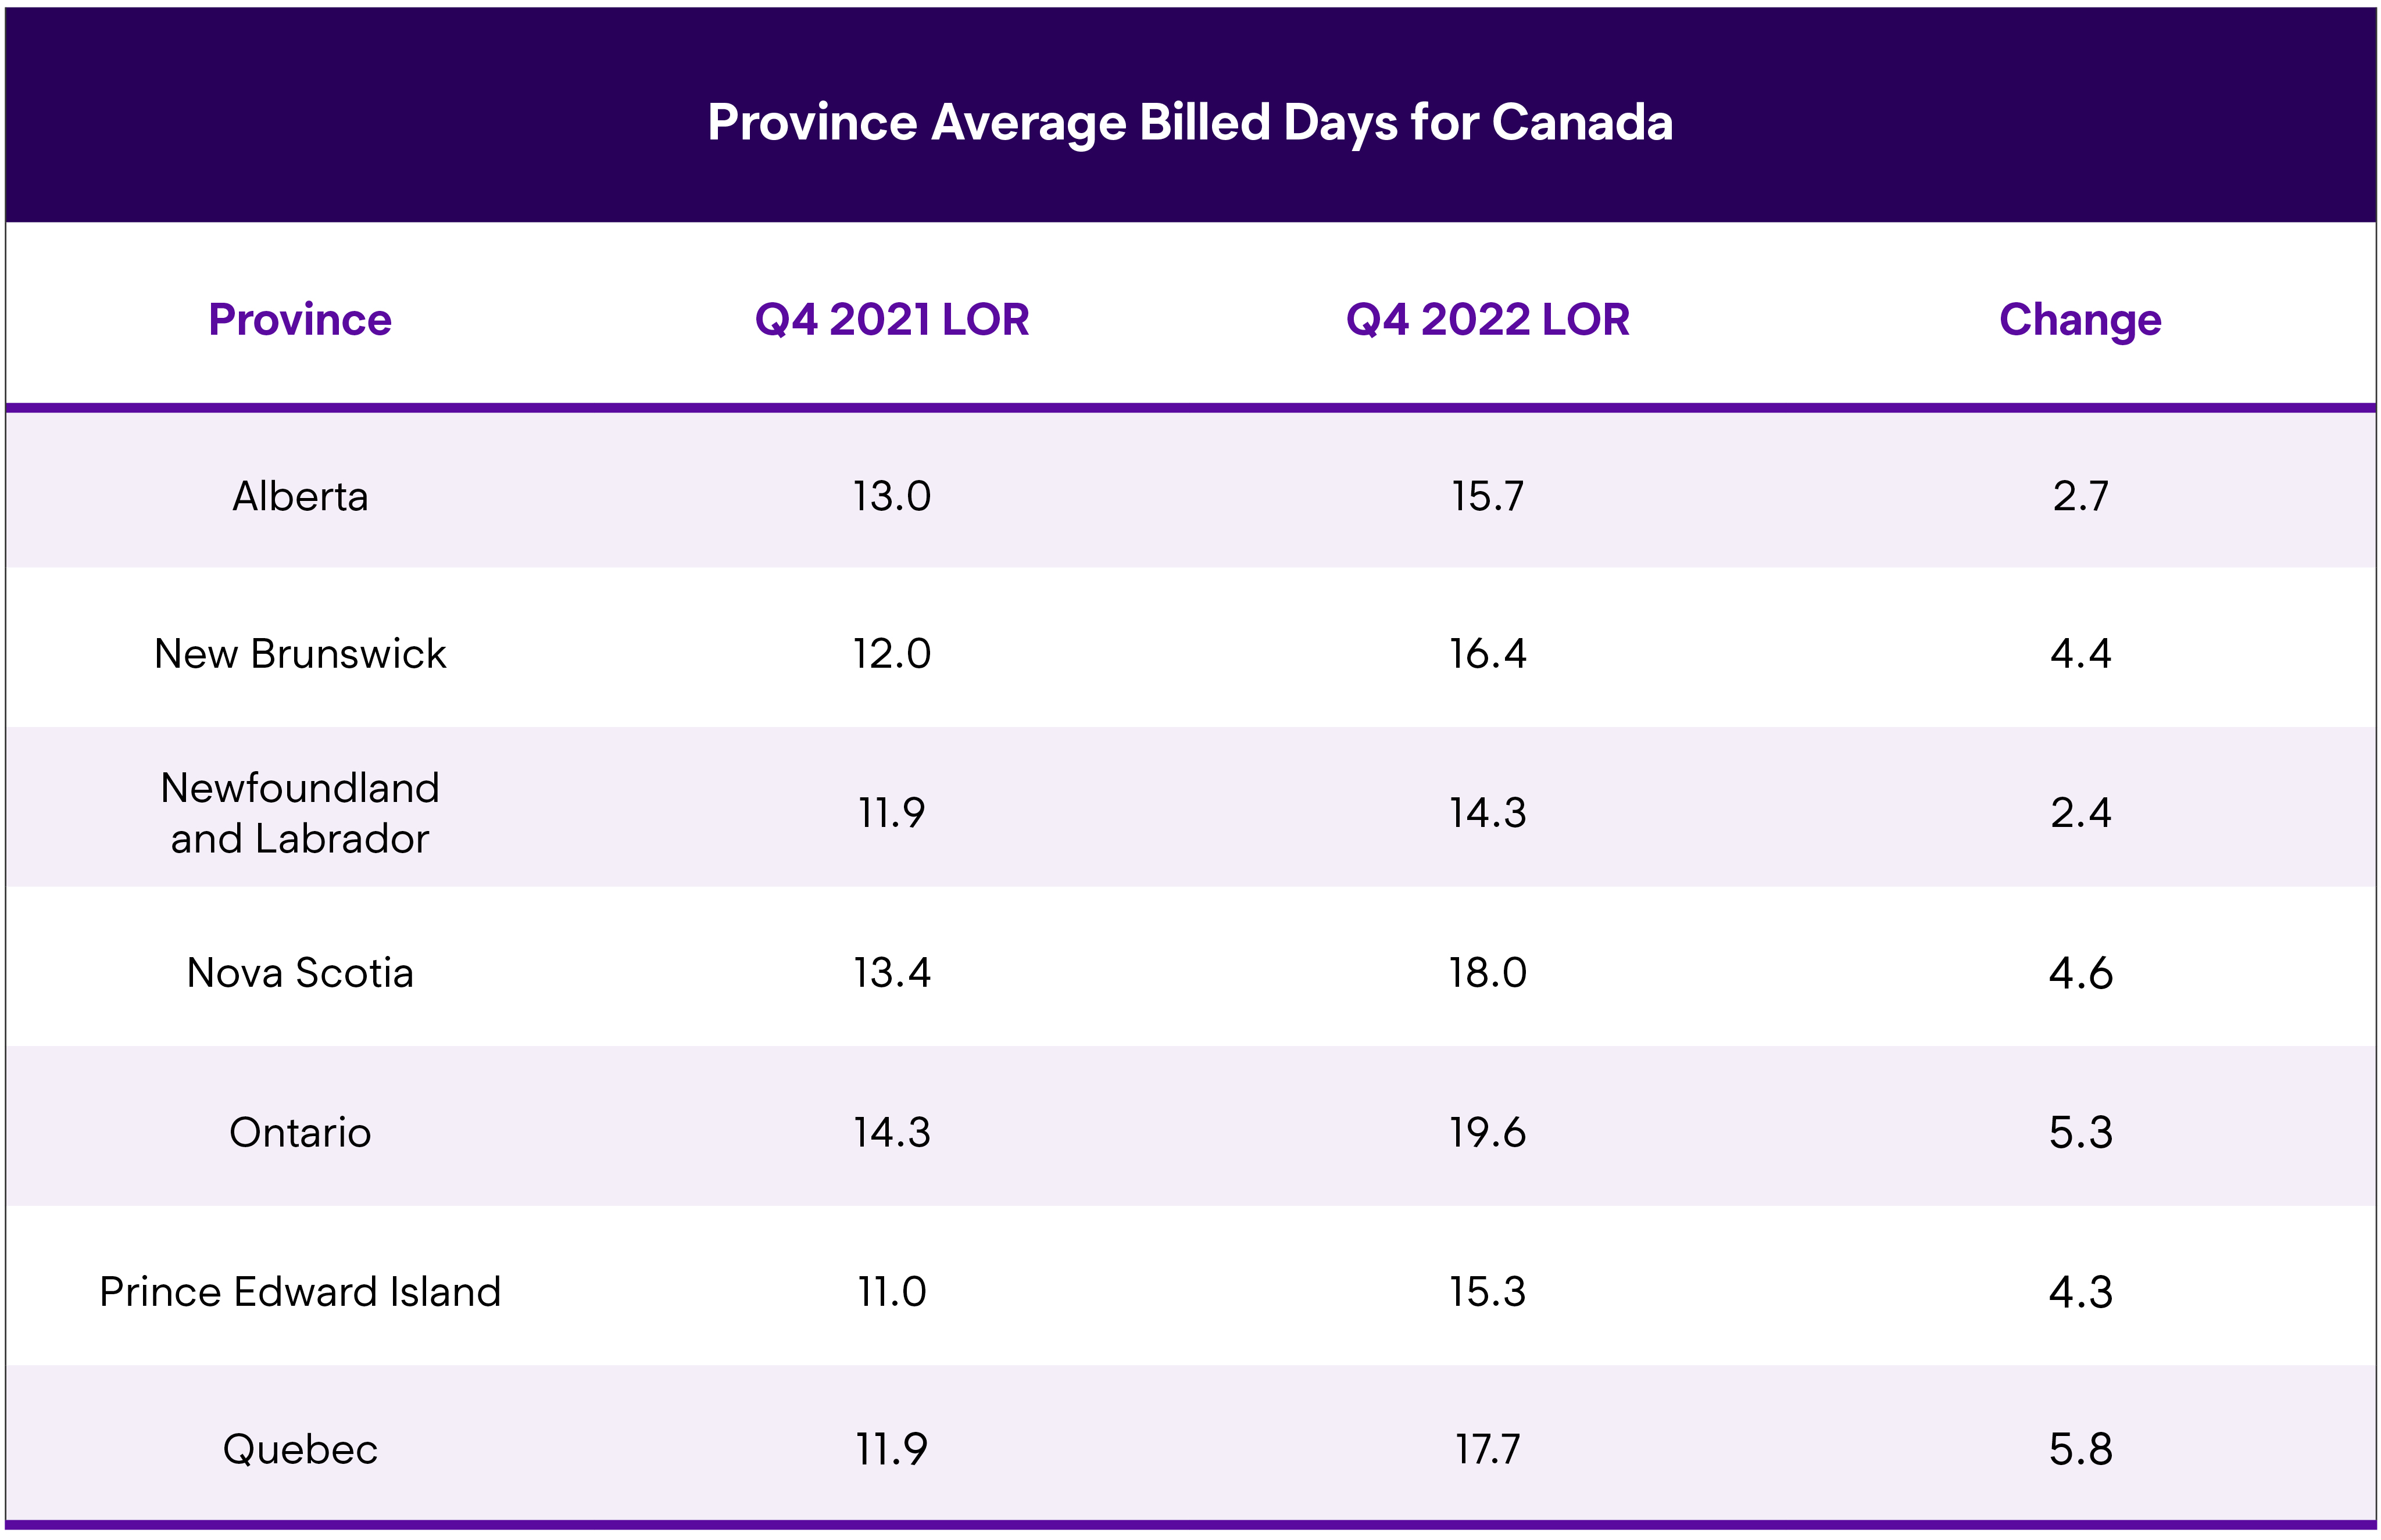
Ontario had the highest overall LOR at 19.6 days, a 5.3-day increase. Next was Nova Scotia (18.0) and Quebec (17.7). Quebec was also the province with the highest overall increase at 5.8 days. Newfoundland & Labrador had the lowest LOR at 14.3 days; PEI and Alberta also had LORs below 16 days.
Given that the Canadian results have now reached the levels seen in the US, we wanted to offer some insights from industry experts—parts issues, technician staffing, and more complex repairs continue to be referenced as the primary factors in longer repair times. John Yoswick, Editor of the weekly CRASH Network newsletter in the US, remarked: “The overall trends in LOR match up with what we saw happen with the backlog of work that repairers reported in our Q4 survey. While the national average backlog remained at 4.8 weeks, unchanged from the record high in Q3, there was another jump in the percentage of shops with the largest backlogs. A record 25% of shops were reporting eight weeks or more of work scheduled. For comparison, in pre-pandemic Q4 2019, just 6.4% of shops had backlogs of even just four weeks or more, and the national average was under two weeks.”
He continued: “Some of the state changes in LOR sync up with what we saw in terms of shops’ backlog of work in Q4. Colorado, Montana, South Dakota and Washington, where Q4 LOR was up by three days or more, are all in regions where we saw Q4 backlogs increase by a half-week or more. These regions were also among those with the highest average Q4 backlog—5.5 weeks or more—compared to the three Sunbelt regions where average backlogs were between 3.5 and 4.9 weeks.”
Greg Horn, PartsTrader’s Chief Innovation Officer who oversees their data analytics department, also commented on Q4 data trends: “At PartsTrader, we processed close to $2 billion in parts transactions in 2022 and track delivery days quoted in our platform. We measure parts delivery days by measuring the median plus two standard deviations to capture the parts that are driving collision repair delays. While delays in parts is only one factor in longer repair times, it is a major one. Our data shows that Q4 2022 median delivery days for parts were up by 0.4 days over Q3 2022, which tracks with Enterprise’s LOR reporting. Similarly, when we compared the Q4 2022 delivery days for parts to Q4 2021, we measured a nearly identical increase of 1.5 days. This would indicate a strong correlation between parts fulfillment and length of rental increases.”
Ryan Mandell, Director of Claims Performance for Mitchell International, shared some relevant Canadian data: “Average total labor hours increased to 21.78 hours, an increase of 0.61 labor hours from Q4 2021. This is significant as we expect there to continue to be significant development of this number as only about 60% of supplements expected have been accounted for thus far. Luxury vehicles continue to increase as a percentage of the repairable car parc, accounting for 17.91% in Q4 2022 compared to 17.77% in Q4 2021. Tesla repairable market share increased from 1.04% in Q4 2021 to 1.55% in Q4 2022.”
Drivable
Drivable LOR was 12.4 days in Q4 2022, a 2.4-day increase over the previous year’s fourth quarter. Much of the national increase came from Ontario, which had the highest drivable LOR at 14.5 days, which was a 3.2 day increase. On the lower end, New Brunswick had a drivable LOR of 10.0 days, with PEI (10.2), Quebec (10.4) and Newfoundland & Labrador (10.4) closely following.
Non-Drivable
Non-drivable LOR was 31.0 days, a 10.3-day increase from just one year ago. Interestingly, this is slightly down from Q3 2022’s results which were 31.4 days. Ontario (34.2), Nova Scotia (33.1) and PEI (33.1) were the highest; Ontario’s increase of 12.0 days was also tops. Conversely, Quebec’s LOR was 24.9 days, which was still an 8.2-day increase from Q4 2021. The non-drive LOR in the US for Q4 22 was 27.1 days.
Yoswick offered additional insights into the repair backlog: “Parts issues, workforce challenges and more harder-hit vehicles are also showing up in another increase in late 2022 in how many jobs shops say they have in-process relative to their typical workload. The 300+ shops responding to a CRASH Network survey in December had an average car count of 79 jobs per month and reported currently having 61 jobs in process, or the equivalent of 77% of their typical monthly volume. That level of work-in-process is up from 64% three months earlier.”
“It may not be surprising to see WIP (work in progress) rising even further in the fourth quarter, typically the busiest in many regions of the country, but most shops are still citing a lack of technicians and parts delays as the chief causes for the backlog of work,” added Yoswick. “Some shops also noted a higher than usual number of non-drivable repairs gumming up the works.”
Total Loss Claims
Total Loss LOR was 25.5 days, an 8.1-day year-over-year increase (17.4). Newfoundland & Labrador (17.8) was the only province under 22 days, with PEI tops at 29.8 days, a 12.6-day increase.
Data excludes the private carrier provinces of British Columbia, Manitoba and Saskatchewan.
Summary
The results for the fourth quarter of this year are significant, with results exacerbated by supply chain disruptions, parts delays, collision repair backlogs, and technician shortages. With the complexity of vehicle repairs only increasing, for both internal combustion engine (ICE) and battery electric vehicles (BEV) models, the entire industry must play a part in ensuring all collision-related businesses are aligned—not just for procedural solutions, but to ensure our mutual customers receive safe and proper repairs, an excellent experience and peace of mind.
Enterprise is committed to partnering with insurers, repairers, and suppliers on each one of these issues. Through foundational support provided by the Enterprise Holdings Foundation, Enterprise is spearheading the Collision Engineering Program, designed to attract and develop entry-level talent to fill essential roles within the collision repair industry. Enterprise is thrilled to expand its longtime partnership with Ford Motor Company, through its philanthropic arm, the Ford Fund, to expand the program and help address this ongoing industry challenge. For more information, visit beacollisionengineer.com.