

Average Length of Rental for Repairable Vehicles: Q3 2022
The quarterly LOR summary is produced by Enterprise Rent-A-Car. Through its ARMS® Automotive Suite of Products, Enterprise provides collision repair facilities with free cycle time reporting with market comparisons, free text/email capability to update their customers on vehicle repair status, and online reservations. More information is available at armsautosuite.com.
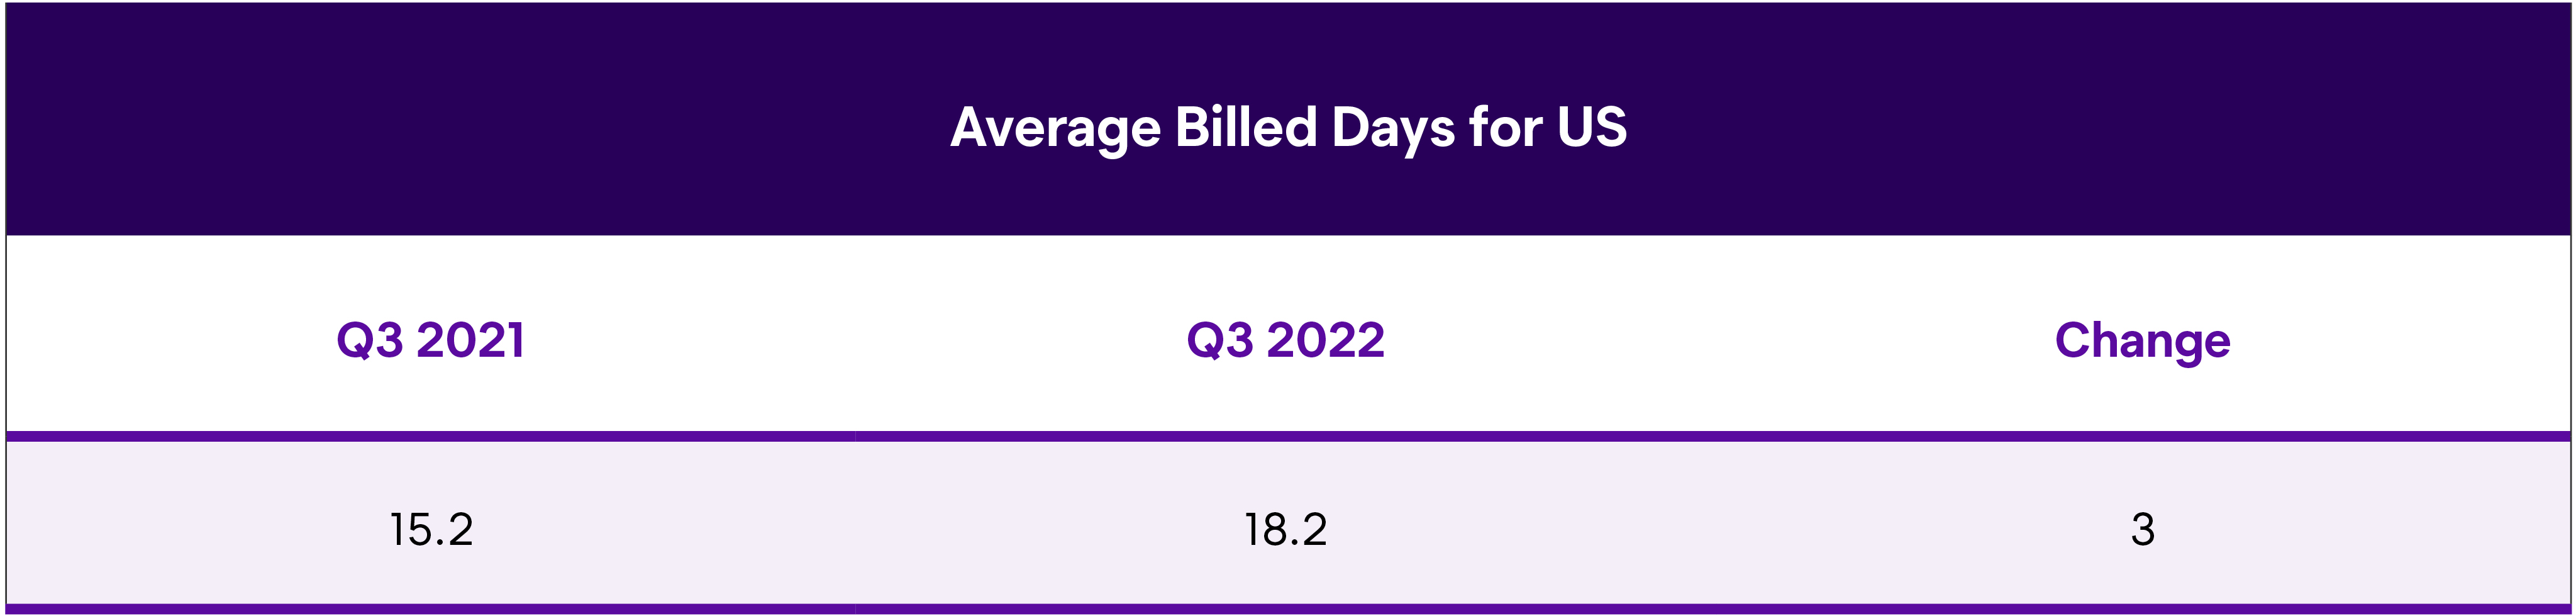
U.S. Length of Rental—Q3 2022
Average Length of Rental (LOR) for collision replacement-related rentals in Q3 2022 was 18.2 days, representing a three-day increase from Q3 2021 (15.2 days). Last year, when we compared Q3 2021 to Q3 2020, the results showed a 2.9-day rise. This represents almost six full days in the last 24 months.
As we previously observed in Q2 2022, signs were pointing toward seasonal norms, albeit with higher overall totals. This trend continued; the half-day increase from Q2 2022 (17.7 days) is in line with historical results. For example, in Q3 2021, results were two full days higher than Q2 2021.
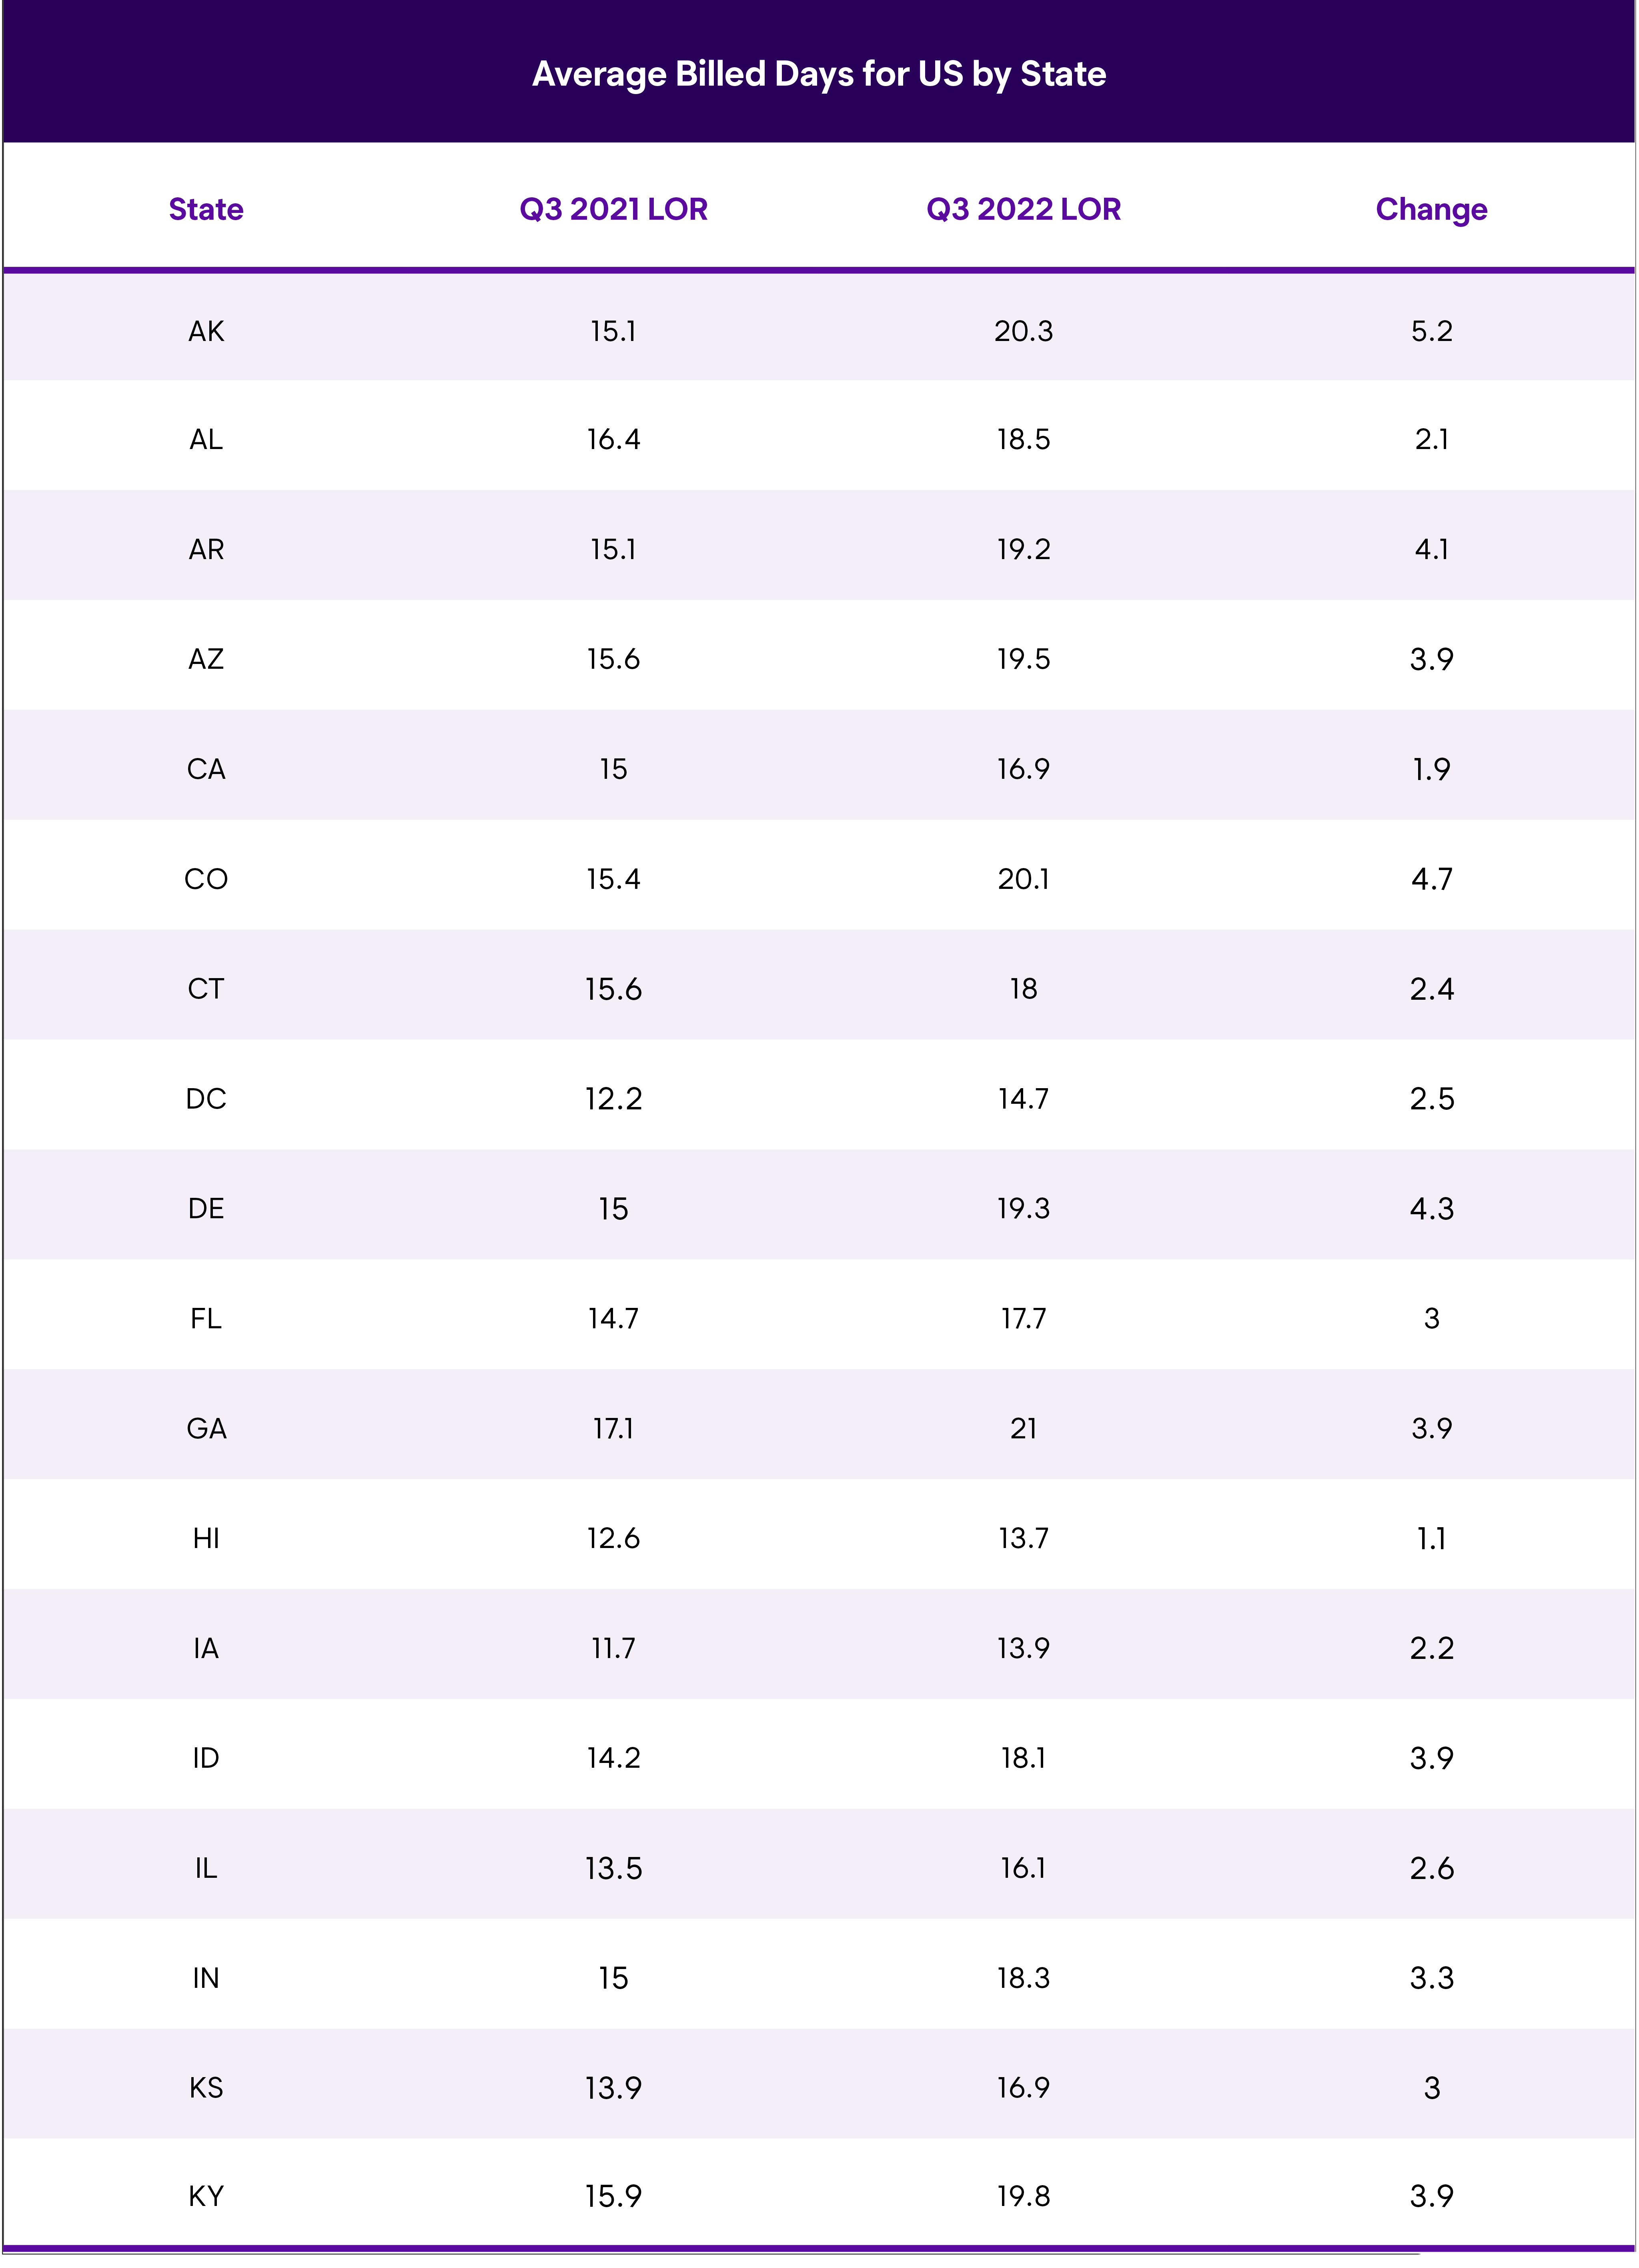
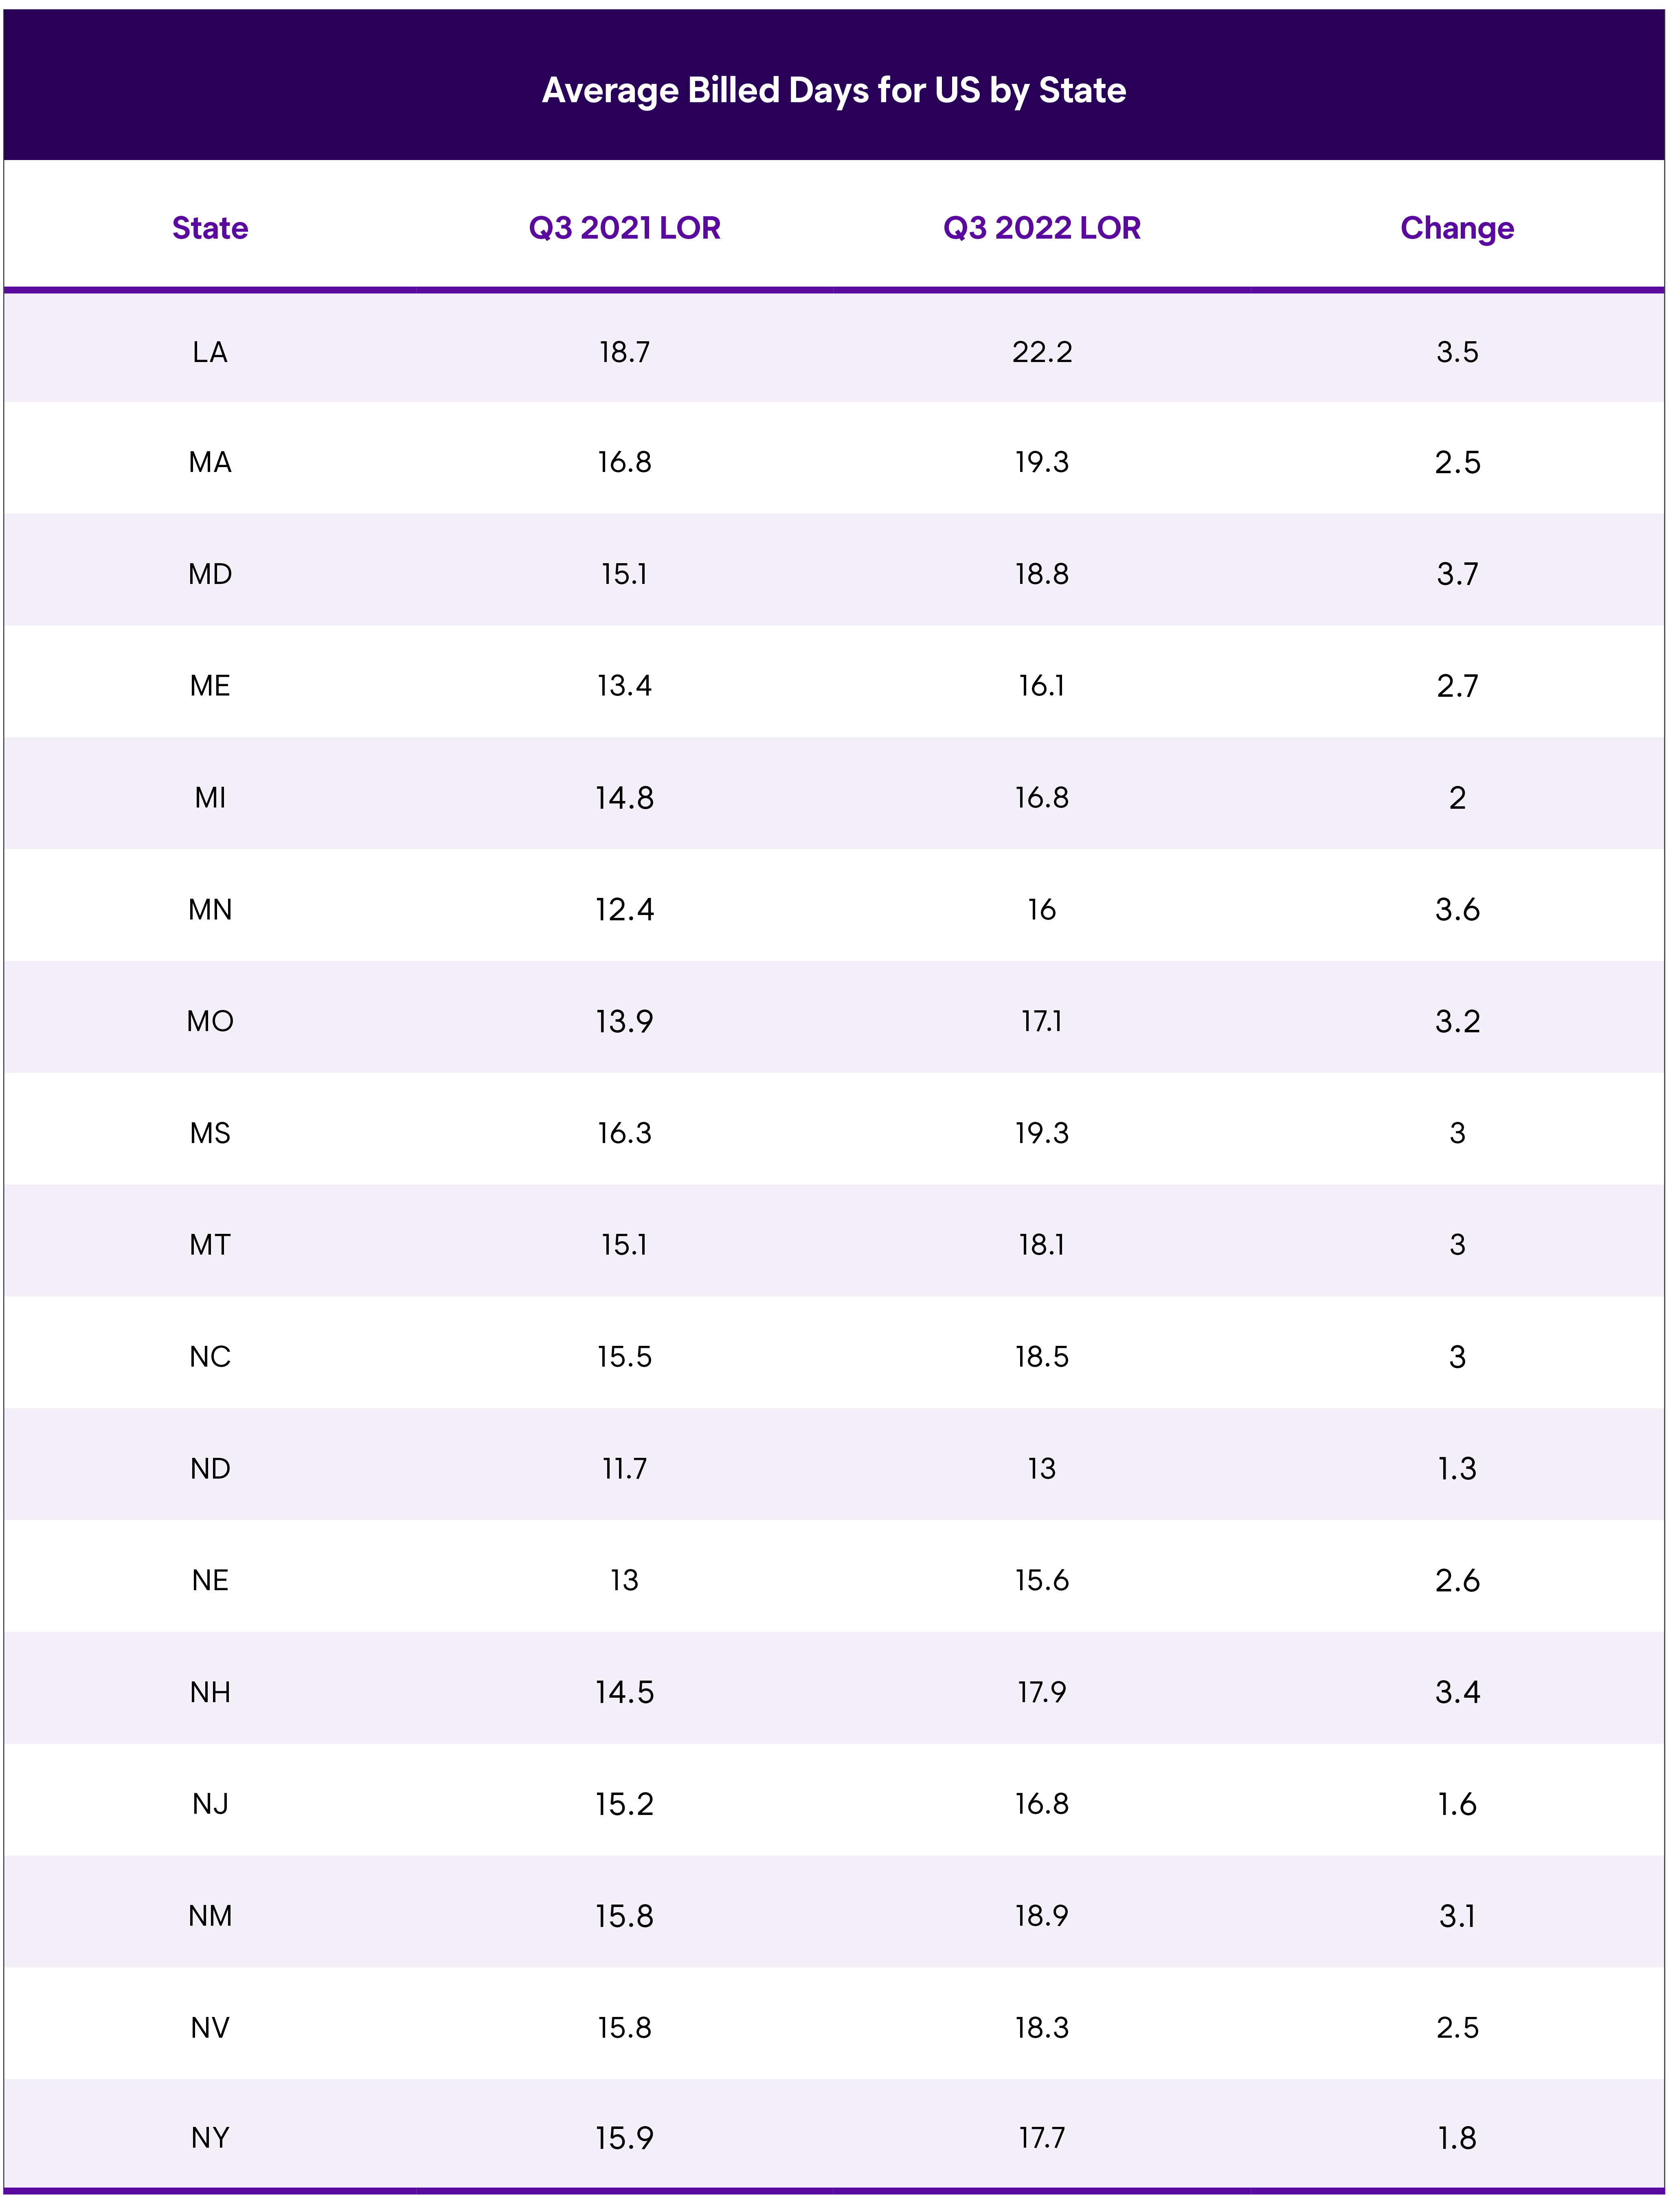
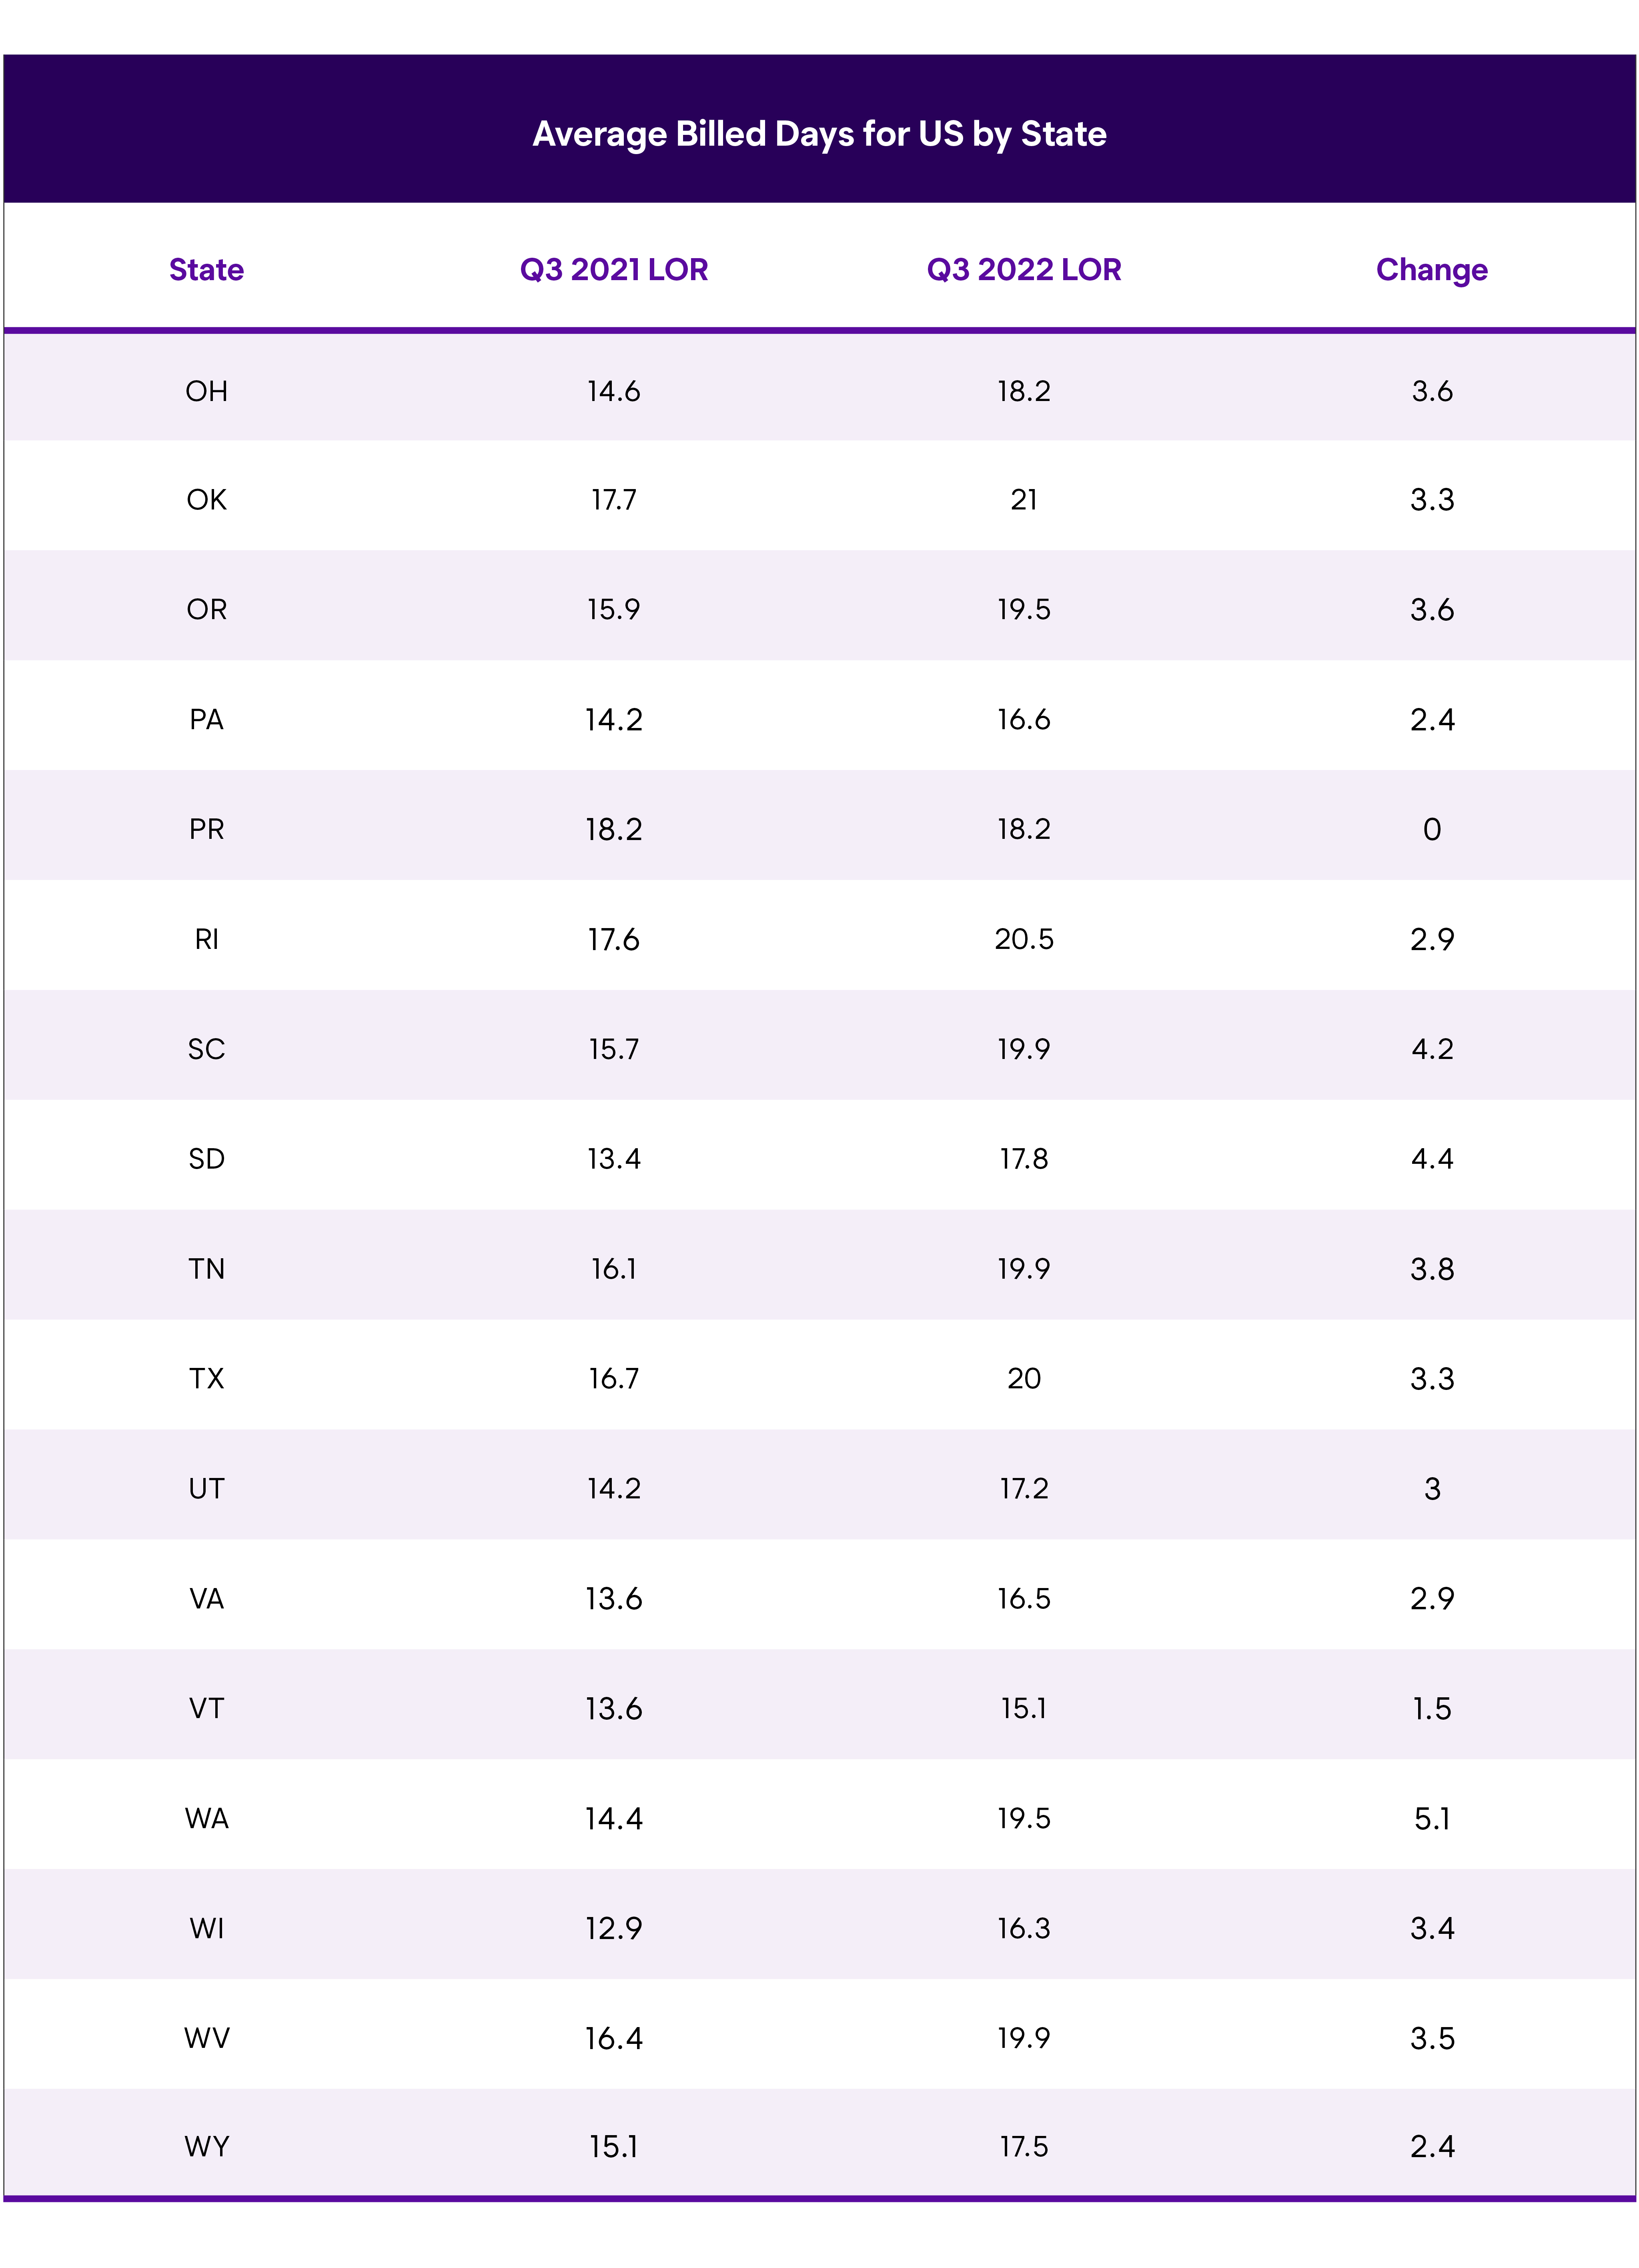
U.S. Average Length of Rental (LOR) By State—Q3 2022
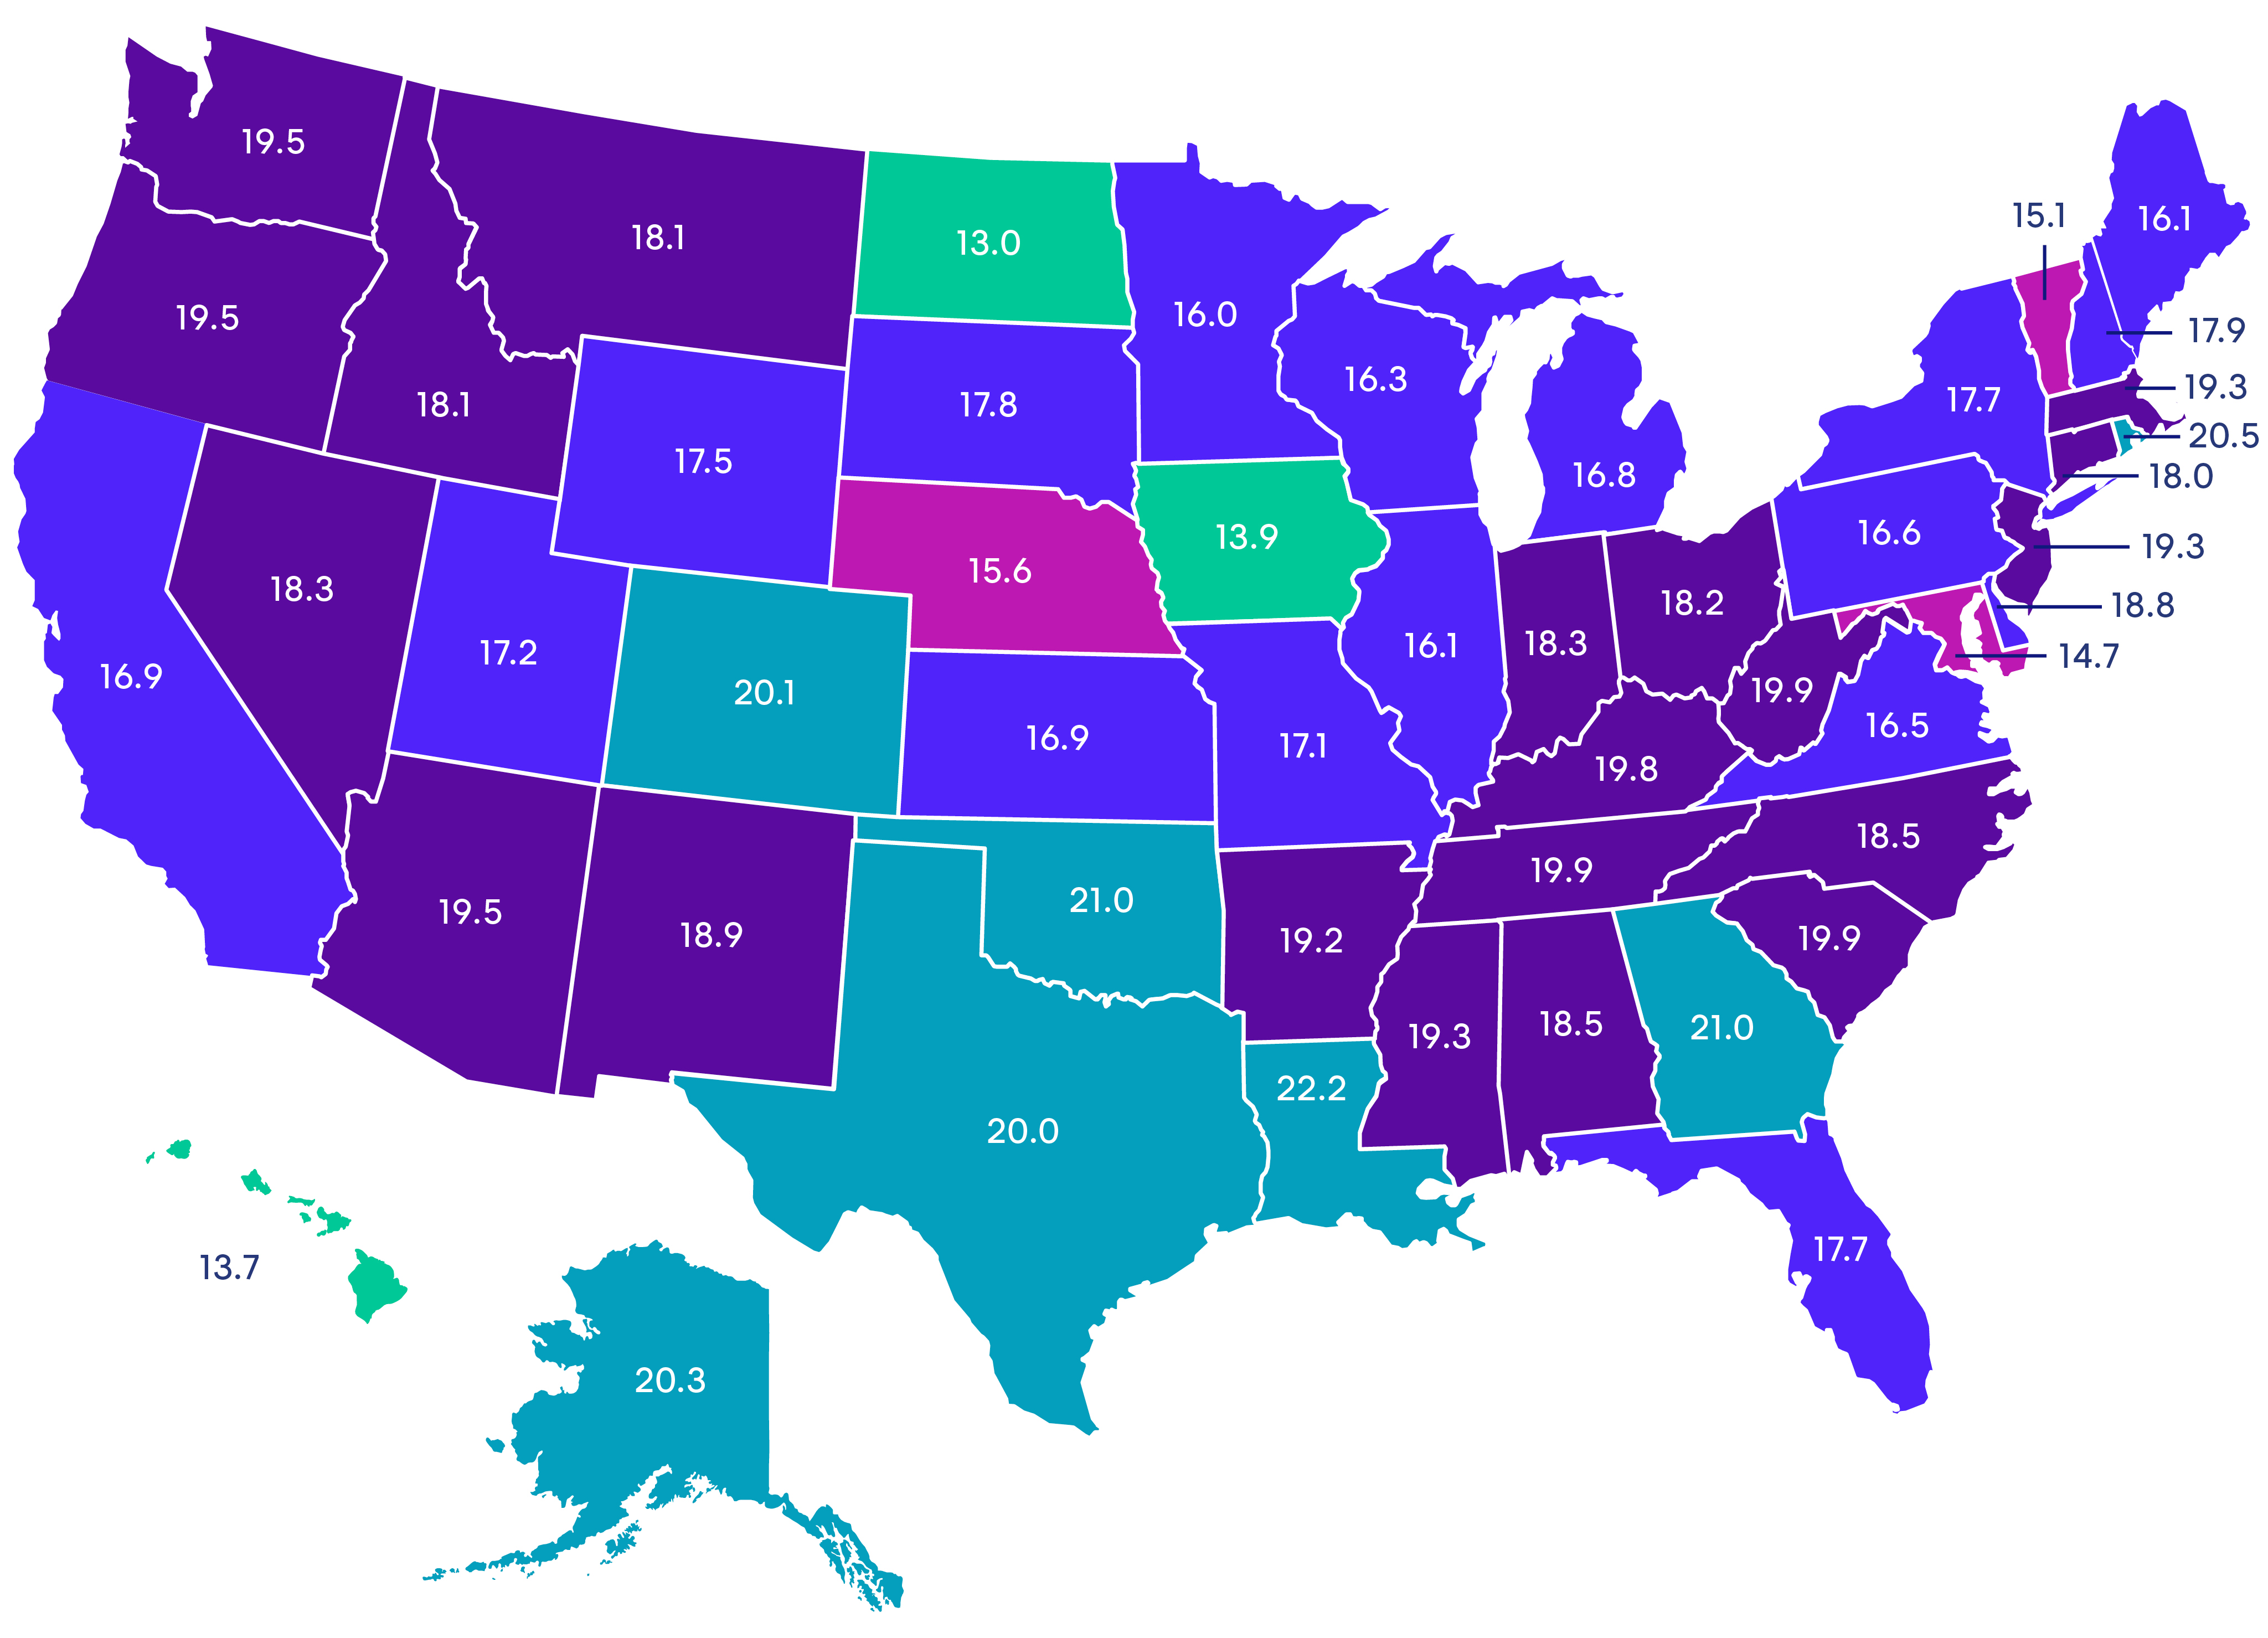
Excludes total losses.
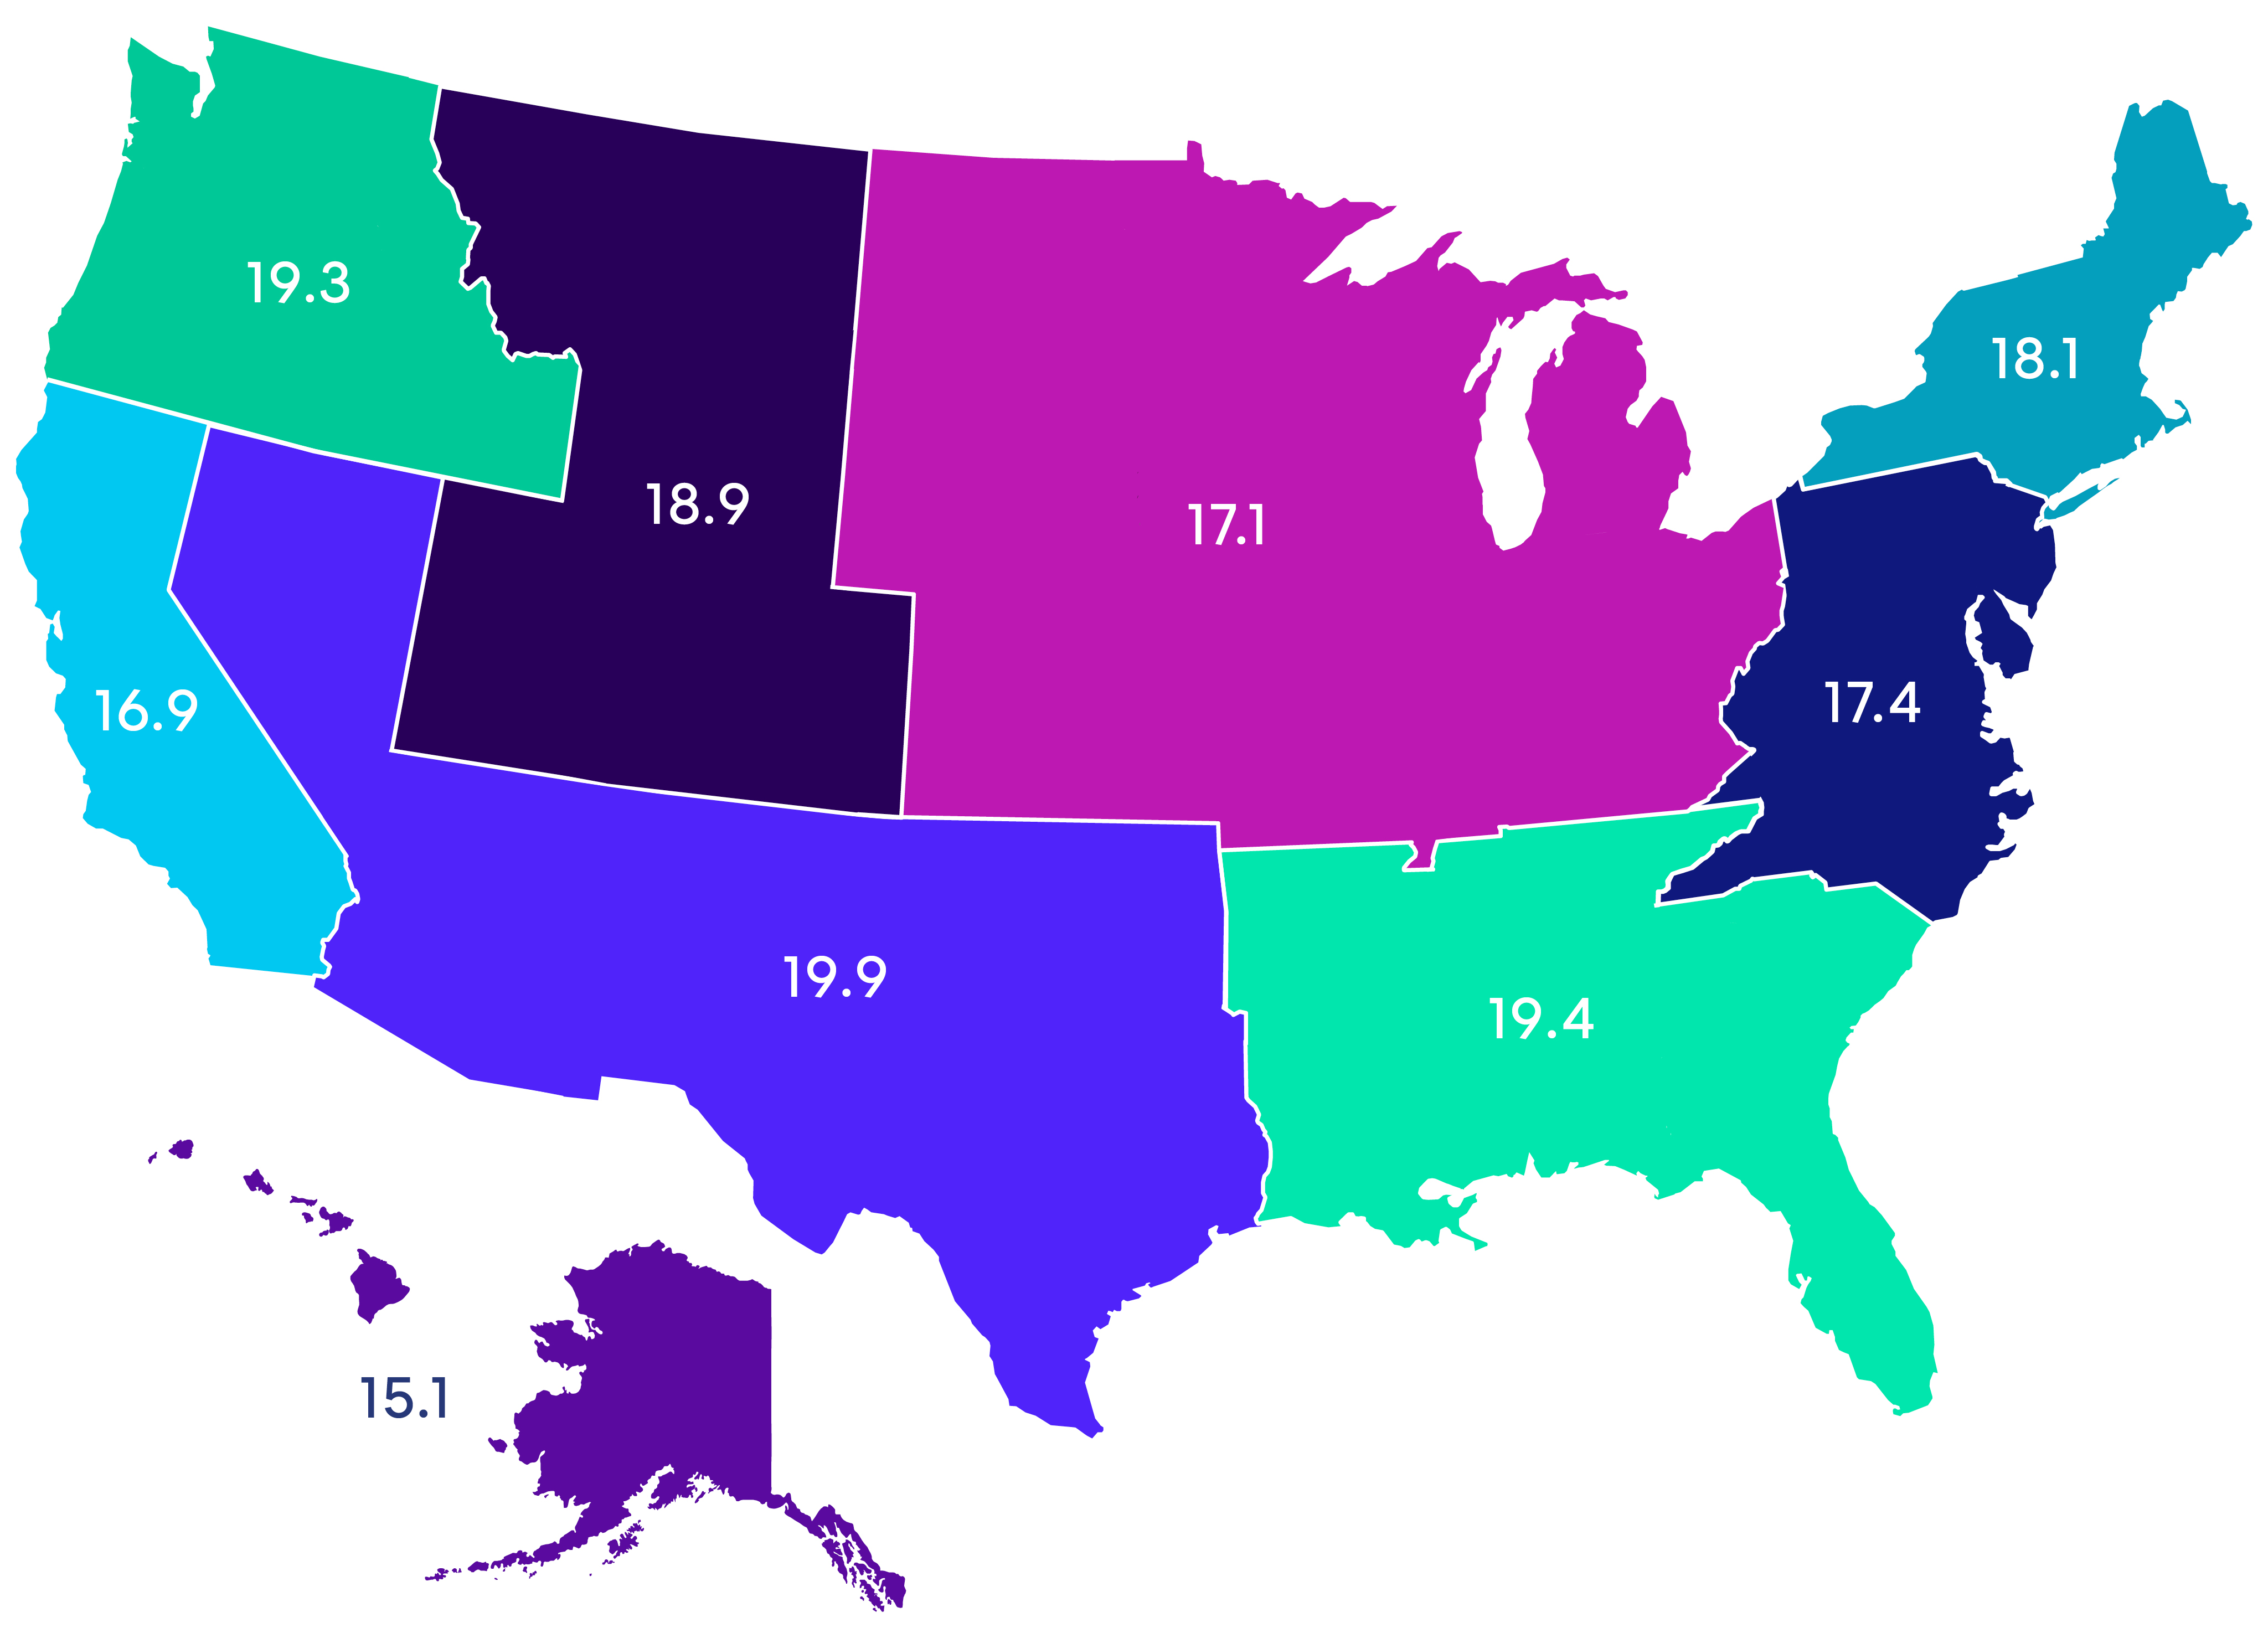
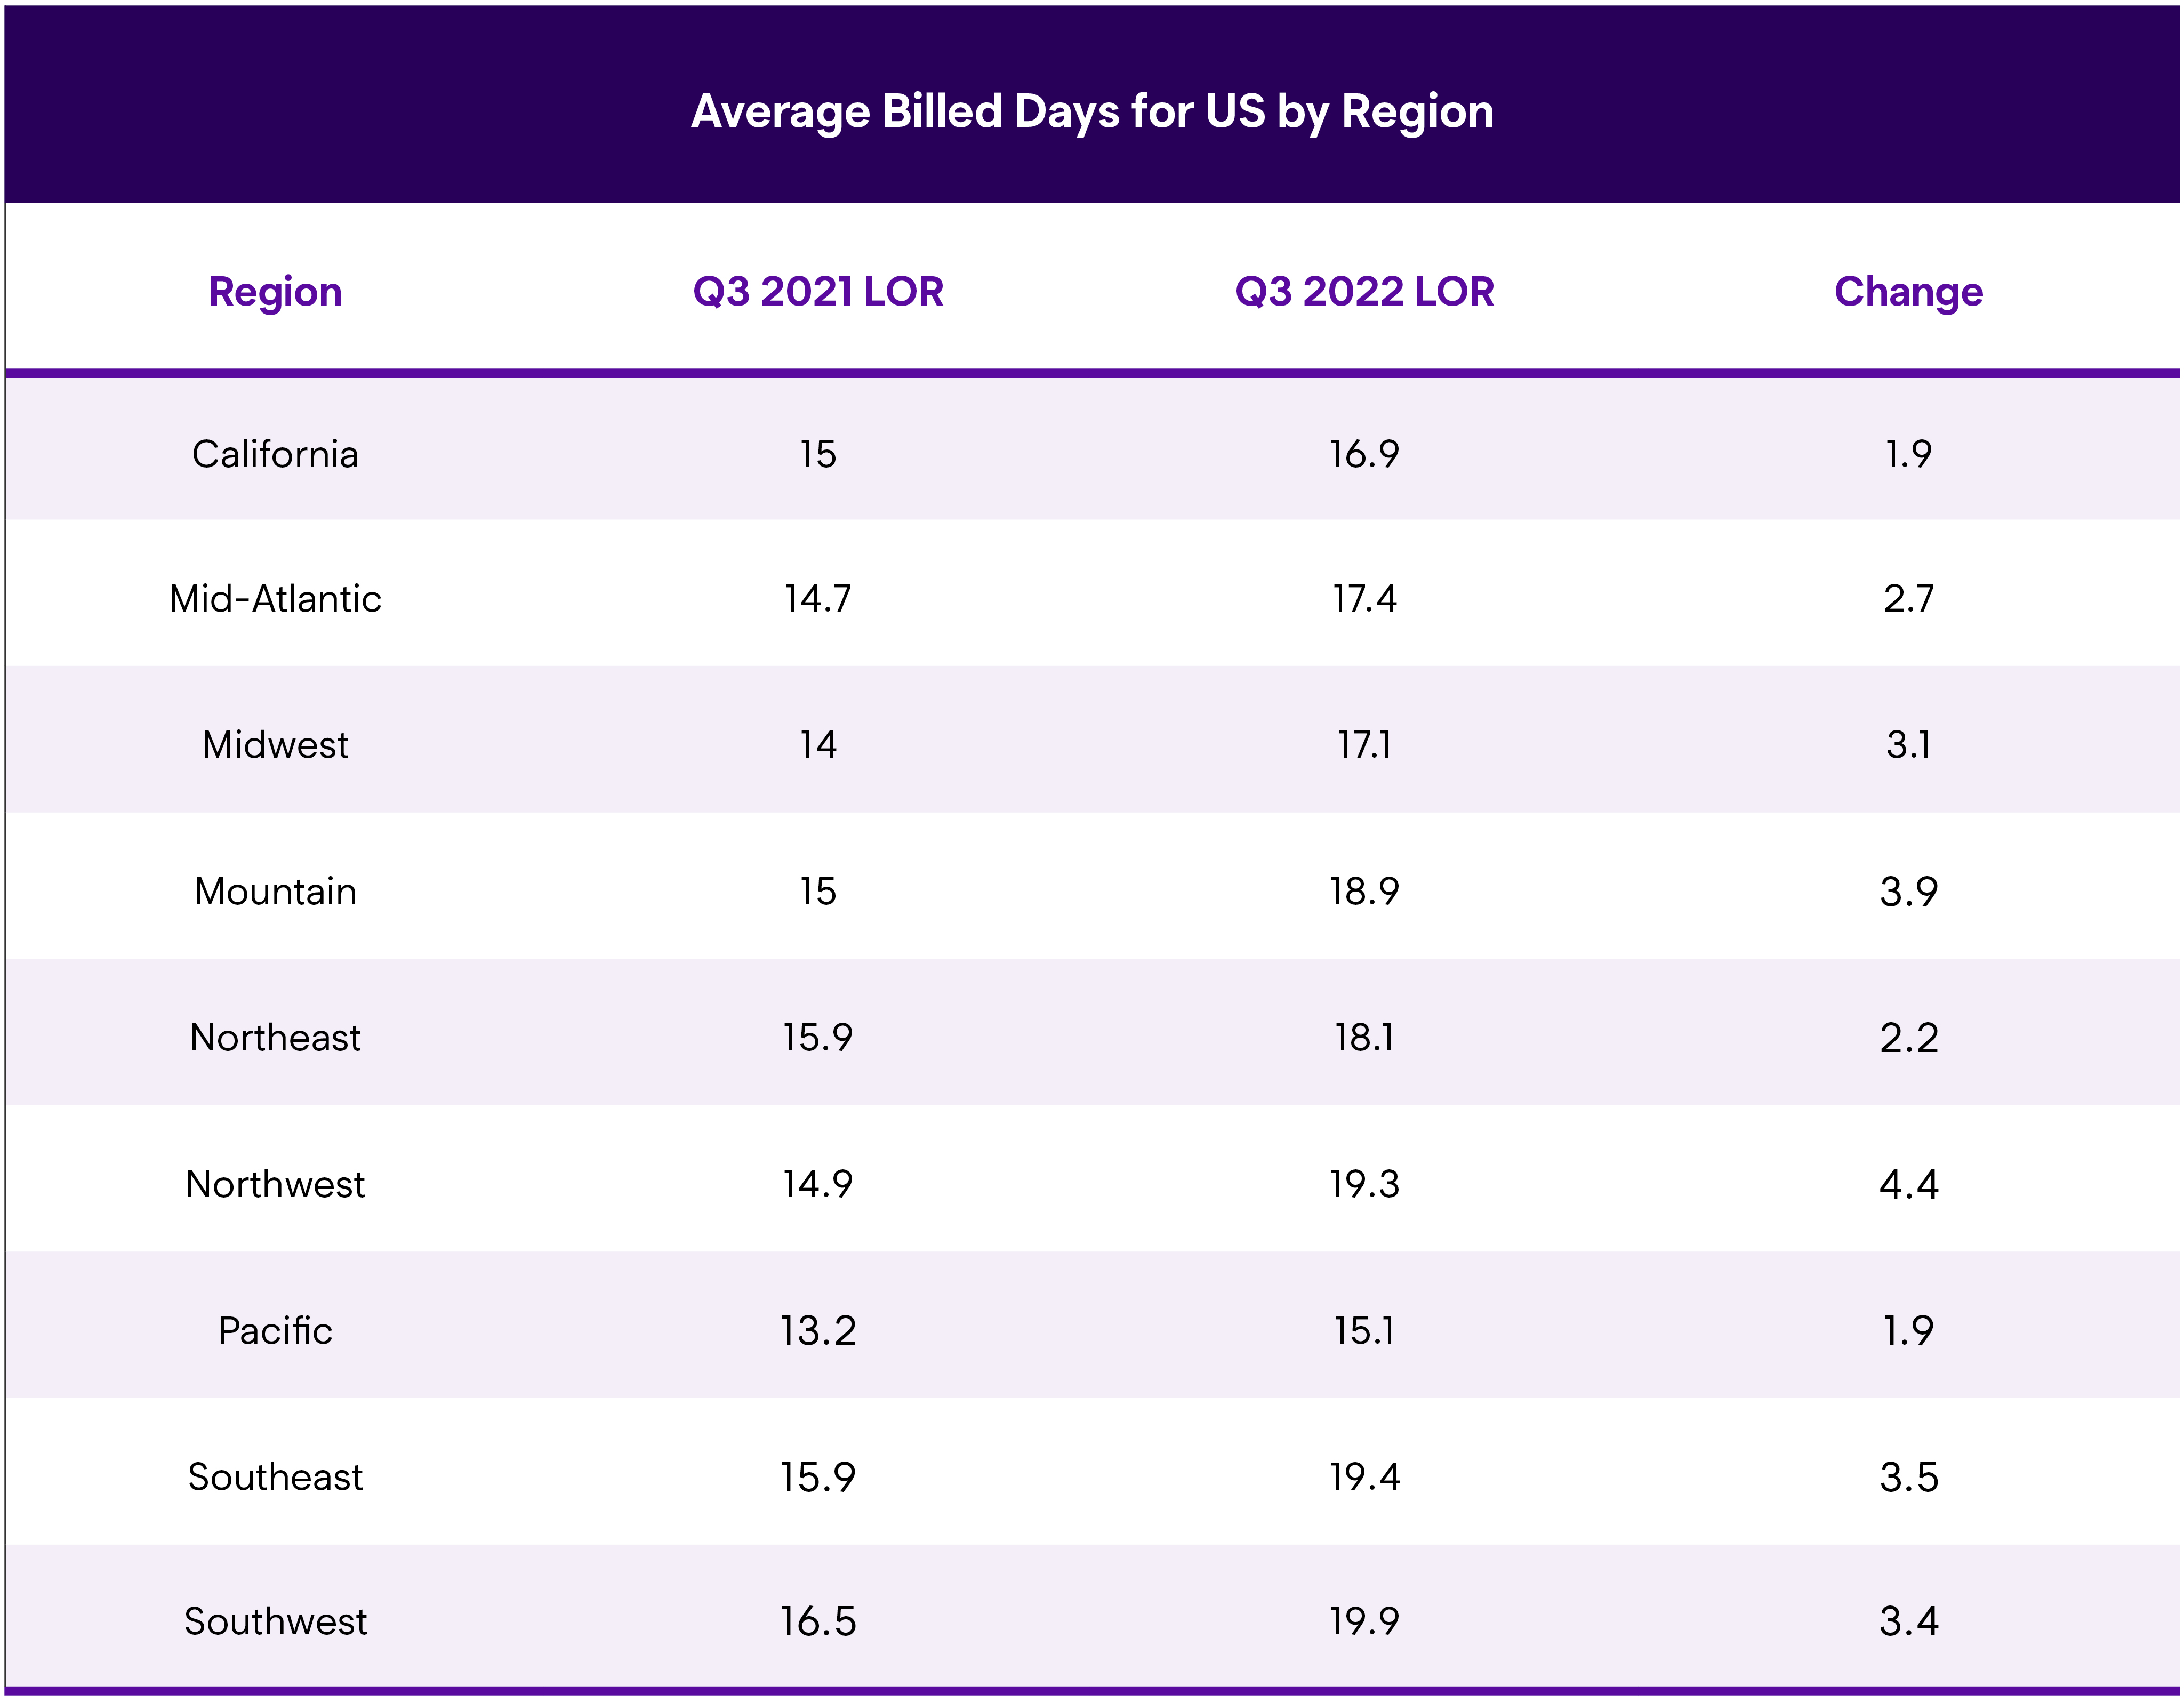
U.S. Average Length of Rental (LOR) By Region—Q3 2022
Overall
Louisiana recorded the highest overall LOR at 22.2 days, a 3.5-day increase from Q3 2021. Georgia and Oklahoma were both at 21 days, a 3.9- and 3.5-day increase, respectively. Rhode Island, Alaska, Colorado and Texas all had results greater than 20 days. Eleven other states were greater than 19 days. On the other hand, North Dakota had the lowest LOR for Q3 2022 at 13.0 days, a 1.3-day increase from Q3 2021. It was followed by Hawaii (13.7), Iowa (13.9), Washington, D.C. (14.7) and Vermont (15.1).
Several industry experts gave their insights into the quarter’s results, and staffing remains the largest concern. John Yoswick, Editor of the weekly CRASH Network newsletter, reported that a CRASH Network survey in June found the vast majority of shops (85%) are currently looking to fill at least one position in their facility, up from 79% a year ago. Body technicians, including helpers, remain the most needed positions in shops. Most shops (67%) are currently searching for at least one body technician (up 5 percentage points from three years ago, pre-pandemic), and 38% of shops are looking to hire a body helper (up 7 percentage points from both a year ago and three years ago).
Yoswick also shared information about the high backlog of repairs found across the country: “After easing a bit in the second quarter, the backlog of scheduled work at shops nationwide rose to an average of 4.8 weeks in July, up from 4.3 weeks in the second quarter, and a new record high. Nearly one in five shops (18.5%) are scheduling more than eight weeks out, a percentage that, until this past year, had never exceeded 2%.” Yoswick observed, “The high volume of shops scheduling more than eight weeks out could indicate that the average backlog is even longer than the survey indicates because ‘more than eight weeks’ is the longest time period response available to survey participants.” Yoswick also added that, out of necessity, the average backlog time periods have been extended on the newest surveys.
Yoswick also added some additional insights, “More than 400 shops responded to the backlog survey questions, with fully 85% of those shops scheduling out two weeks or more. Only one in 100 shops said they have no backlog and can schedule new work in immediately; only two regions in the country had an average backlog of less than a month.”
We asked Greg Horn, Chief Innovation Officer at PartsTrader, for his thoughts on the increases in Length of Rental and the impacts parts shortages may have on backlogs and cycle times.
Horn noted, “Aftermarket parts—as measured by the number of quotes per part—were in line with previous quarters. However, the median plus two standard deviations delivery days in July and August for aftermarket parts did spike up to over 3.5 days, the highest median this year.”
Ryan Mandell, Director of Claims Performance for Mitchell International, broke down some informational vehicle class data, saying, “Trucks and SUVs increased their share of repairable claims volume in Q3 2022 to 57.07%, up from 57.02% in Q2 2022 and 52.46% in Q3 2021. On average, we observe that from 2021-2022, model year truck/SUV keys-to-keys cycle time is 0.7 days longer than passenger cars.”
Mandell continued, “Luxury vehicle frequency continues to increase, with 12.9% of repairable vehicles in Q3 2022 being classified as luxury makes, compared to 12.84% in Q2 2022 and 10.53% in Q3 2021. On average, we observe that from 2021-2022, model year luxury vehicle keys-to-keys cycle time is 2.9 days longer than common make vehicles.”
Drivable
For rentals associated with a drivable repair, average LOR was 15.7 days, a 2.6-day increase from Q3 2021. Louisiana had the highest drivable LOR at 18.6 days, followed by Oklahoma (18.4), Georgia (18.4) and Rhode Island (18.0). Seven other states were greater than 17 days, with another eight above 16 days. Washington (16.5) had the largest drivable LOR increase, up four days, while Colorado (17.1) and Arkansas (16.7) were both up 3.8 days over Q3 2021.
North Dakota also had the lowest LOR for drivable claims, coming in at 9.9 days, a 0.4-day increase from Q3 2021. The next lowest result was Hawaii at 11.2 days (up 0.5) and Iowa at 11.5 (up 1.4).
Non-Drivable
Non-drivable rental LOR was 27.2 days, a 5.3-day increase from Q3 2021. Twelve states had non-drivable LORs greater than 30 days, led by Louisiana (34.3), Alaska (34.2), Colorado (32.2), and Oklahoma (32.0). Washington’s results of 31.9 days represented the largest year-over-year increase at 10.3 days higher that Q3 2021. Including Washington, 34 states plus Washington, D.C., saw increases greater than five full days from Q3 2021.
The District of Columbia had the lowest non-drivable LOR at 22.2 days, which was still an increase of 5.1 days from Q3 2021. New York (23.2 days) and Iowa (23.6) had the next-lowest results.
Horn used the same delivery day measures for OEM parts and observed a spike that exceeded 15 days for the quarter indicating, “This corroborates the longer non-drive rental days, as non-drives will have more OEM parts per repair and therefore more opportunity for long parts delays.” Horn added, “When splitting delivery days by car brand, foreign makes had the longest delivery times with some brands showing median plus two standard days at over 20 days for the quarter.”
Horn concluded, “Longer repair cycle times are not just parts related. A vehicle can’t be returned to a customer if the part just isn’t there. Car makers are continuing to see long-term parts availability issues, whether it’s packing materials to box the finished parts, production line staffing issues or ship and rail delays. There is no quick fix on the horizon.”
The repair backlog that Yoswick and CRASH Network noted earlier has an outsized impact on non-drivable repairs. Yoswick noted, “Shops continue to struggle with high levels of work-in-progress (WIP): jobs stalled because of parts delays or other issues or non-drivable vehicles waiting in the queue.”
Yoswick added, “Among 350 shops responding to CRASH Network’s “Business Perspectives” survey in September, the average shop repairs 80 cars per month and currently has 51 jobs in process, or 64% of their typical monthly volume. Although that is only slightly higher than the average 62% work-in-progress the same survey found in June, it signals that most shops continue to be loaded up with work waiting to be completed.”
“Overall, nine out of 10 shops have 24% or more of their monthly volume in process, but one in four shops have 80% or more of their monthly volume in process, and one in 10 are approaching 120%,” Yoswick concluded.
Total Loss Claims
LOR for rentals associated with a total loss claim was 17.8 days, a modest 1.6-day increase from Q3 2021. There was a wide variance across the country in relation to Q3 2021; on one end of the table is Hawaii with an increase of 7.3 days, with Washington, D.C. (-2.4) and Alabama (-1.1) on the other end.
Hawaii did have the highest total loss LOR at 23.2 days, followed by Washington (21.3) and Louisiana (21.0). North Dakota was lowest at 14.3 days, followed by Iowa (14.8) and Florida (15.2). With the historic flooding and devastation brought on by Hurricane Ian, we would expect to see impacts to Florida’s results in the months to come.
When asked on repairability and total loss mixes, Mandell observed, “Overall repairable volume declined by 1.8% in Q3 2022 compared to Q2 2022 but grew by 6.8% compared to Q3 2021. The increase in repairable volume over Q3 2021 is not only being driven by growth in miles traveled but also by the lower relative frequency of total loss outcomes due to higher vehicle ACVs. Total Loss frequency stands at 14.5% in Q3 2022, up only slightly from 14.4% in Q2 2022 but down significantly from 17.1% in Q3 2021.”
Summary
While Q3 2022 suggests the return of historical trending, the results themselves continue to be exacerbated by supply chain disruptions, parts delays, collision repair backlogs, claims process challenges and technician shortages. And with the complexity of vehicle repairs only increasing, for both internal combustion engine (ICE) and battery electric vehicle (BEV) models, the entire industry must play a part in ensuring all collision-related businesses are aligned—not just for procedural solutions, but to ensure our mutual customers receive safe and proper repairs, and excellent experience and peace of mind.
Canadian Average Length of Rental (LOR) By Province—Q3 2022
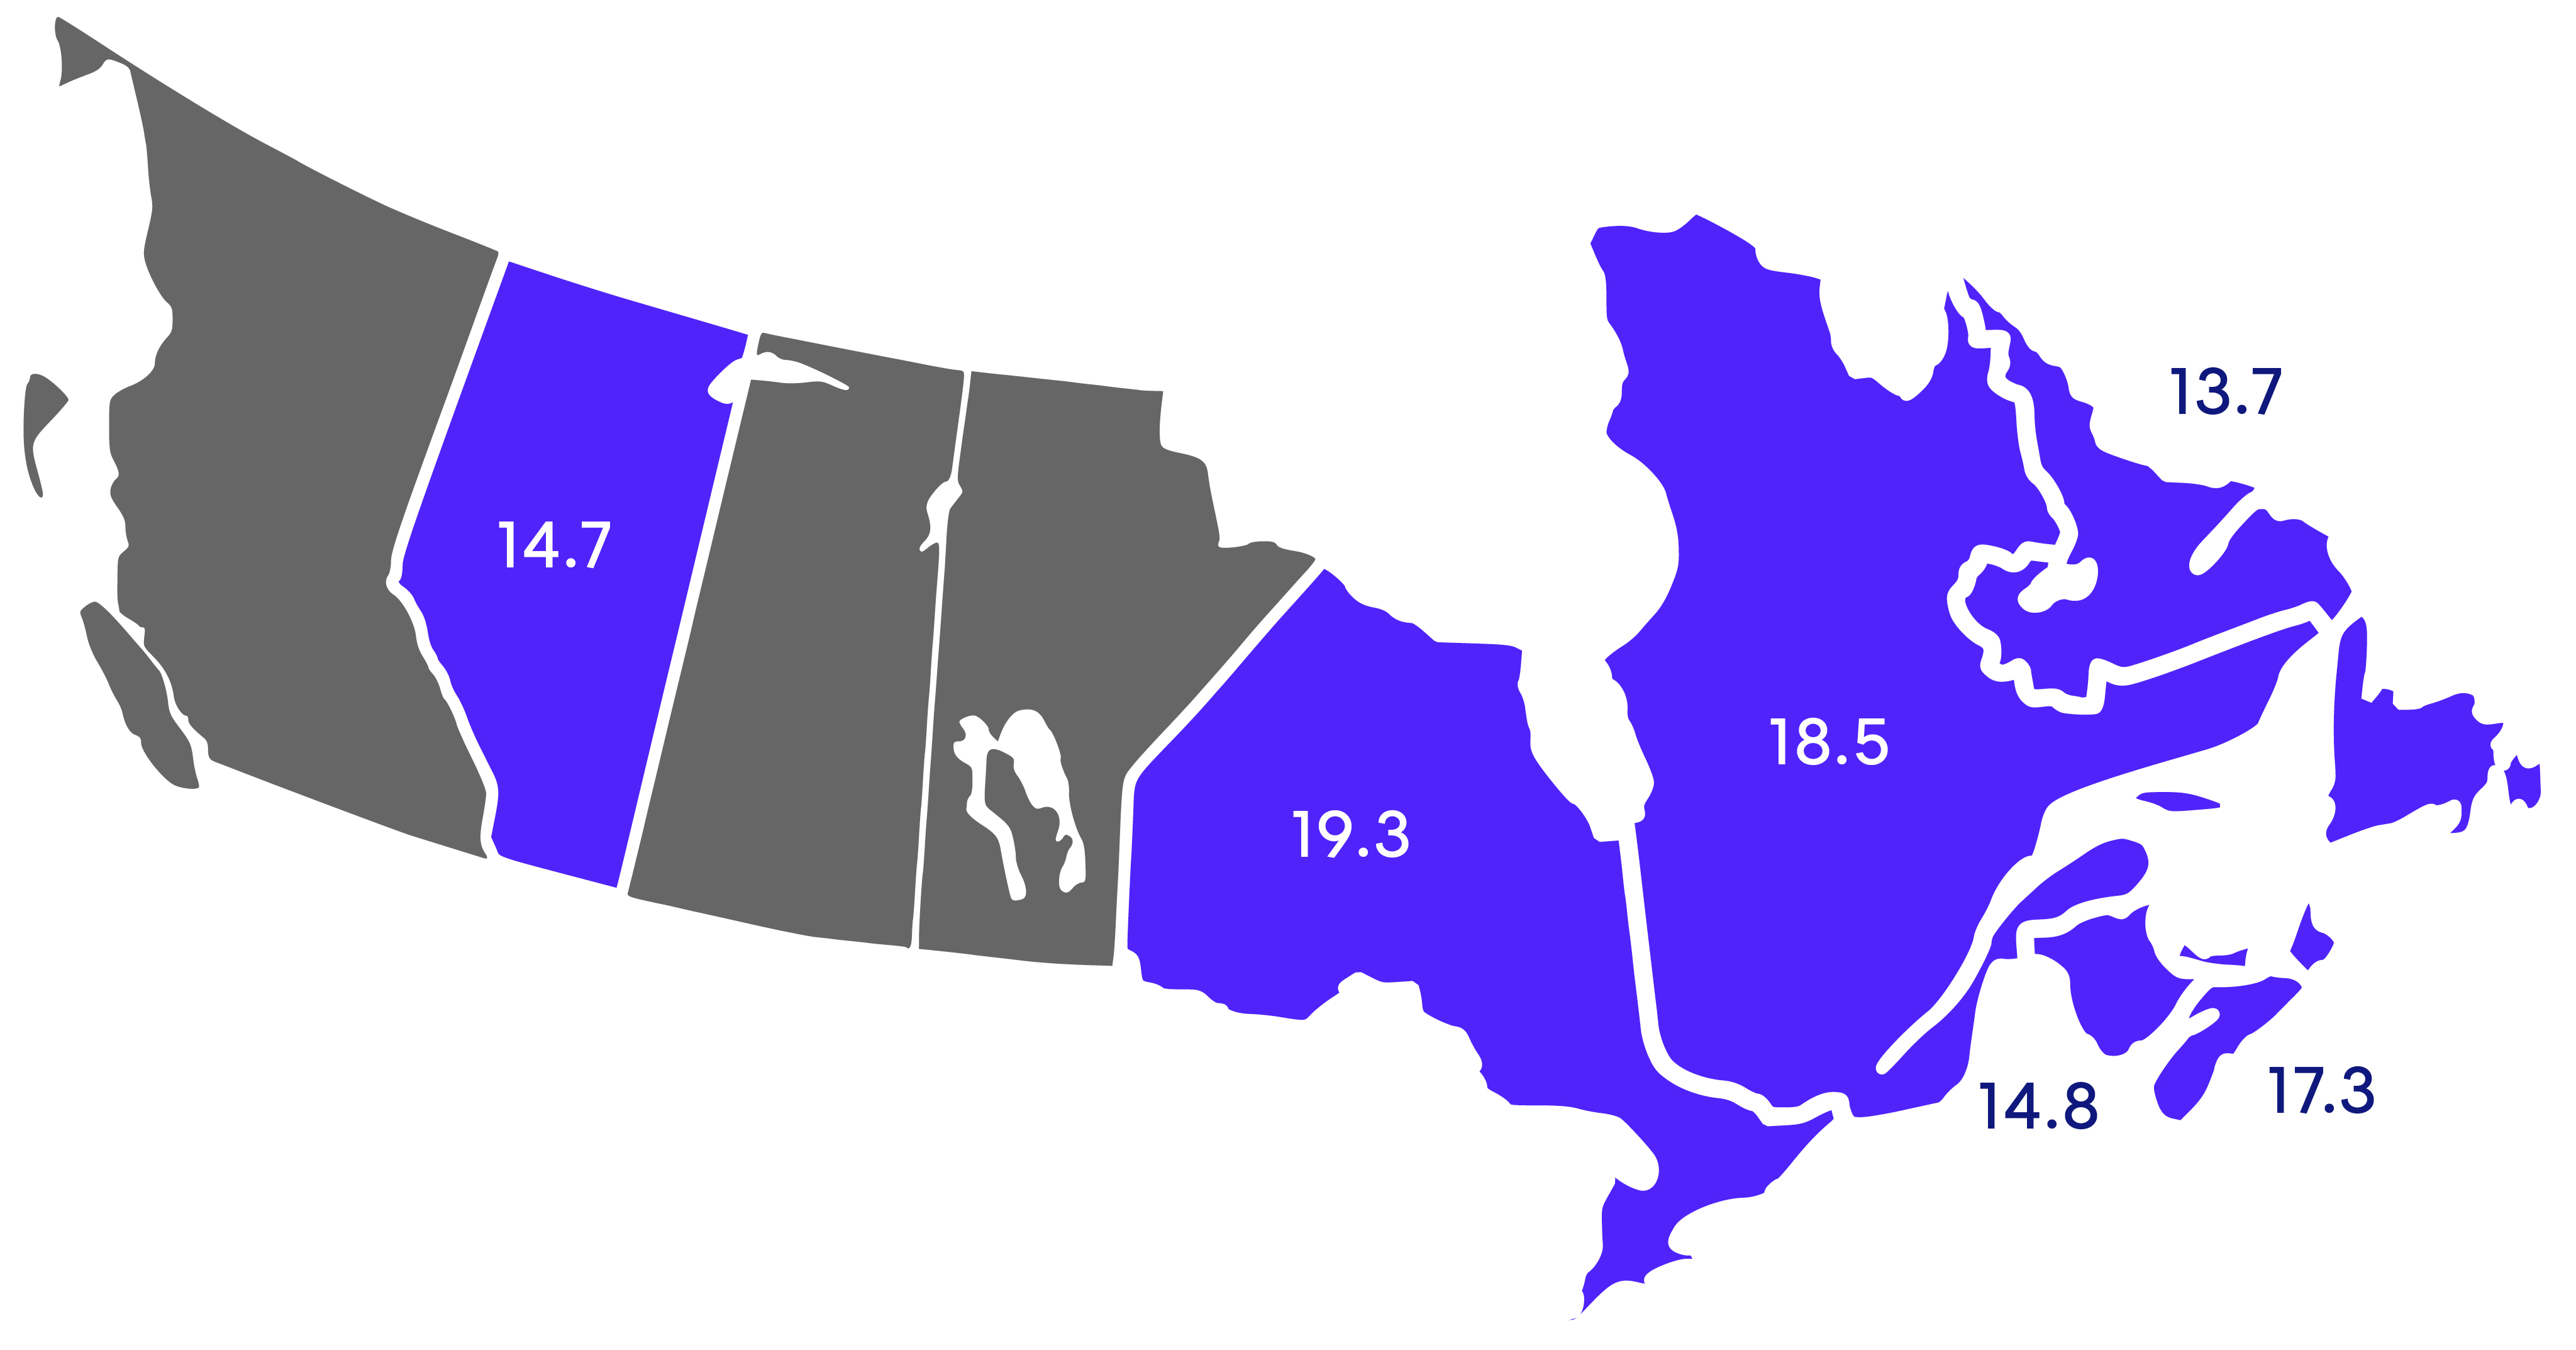
Excludes total losses.
Overall
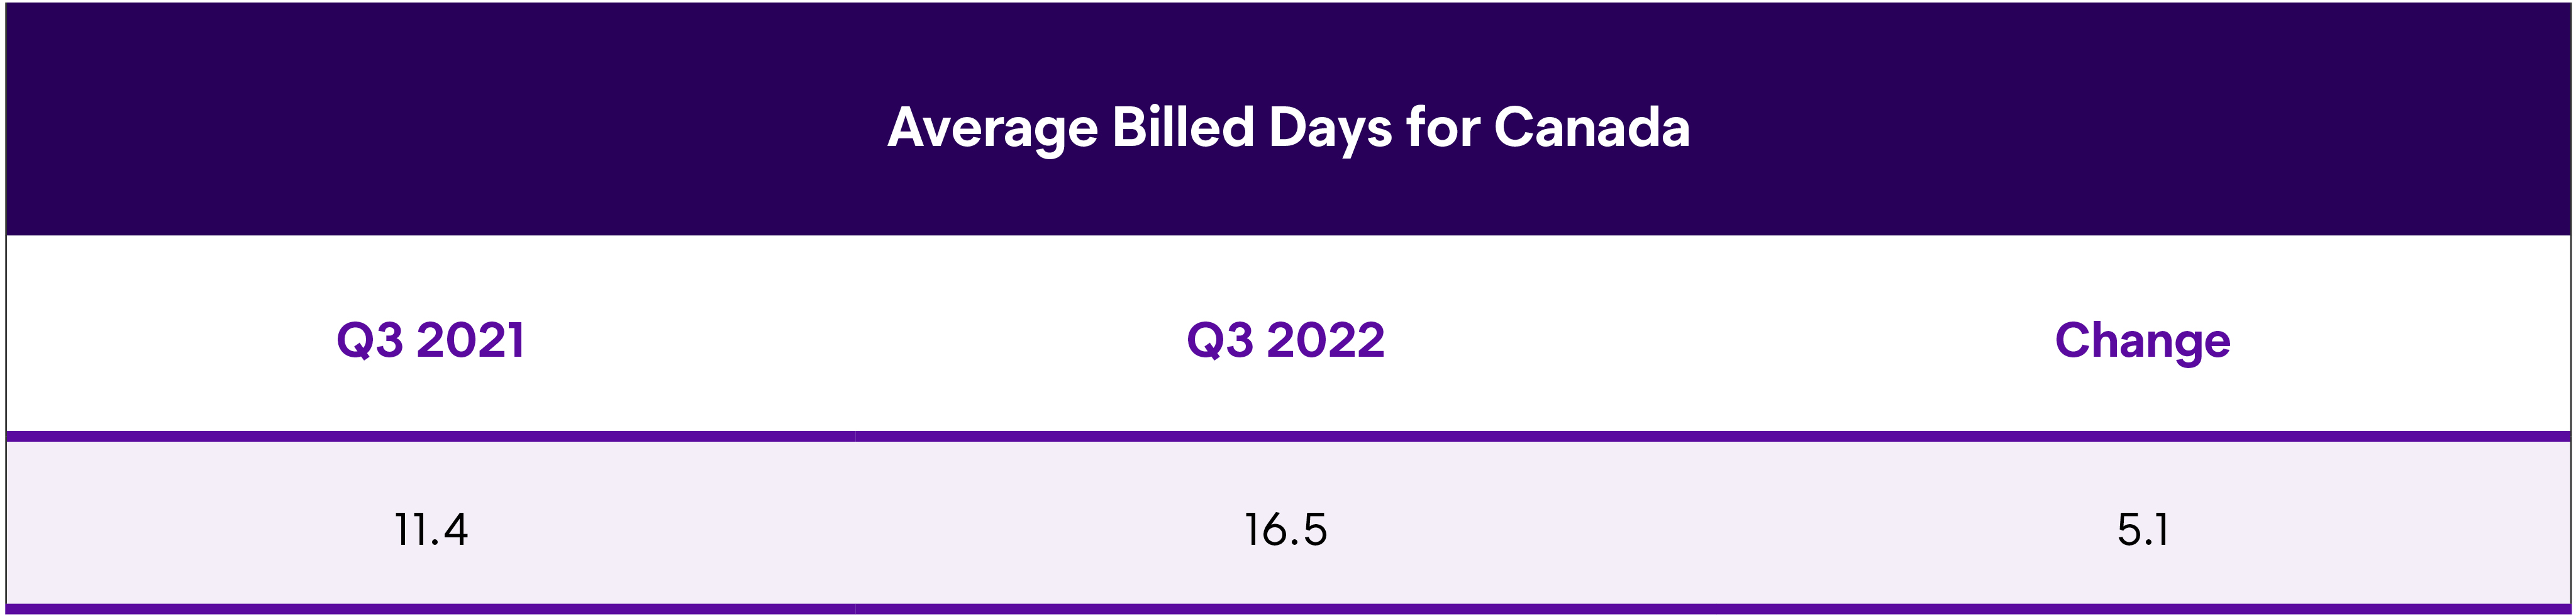
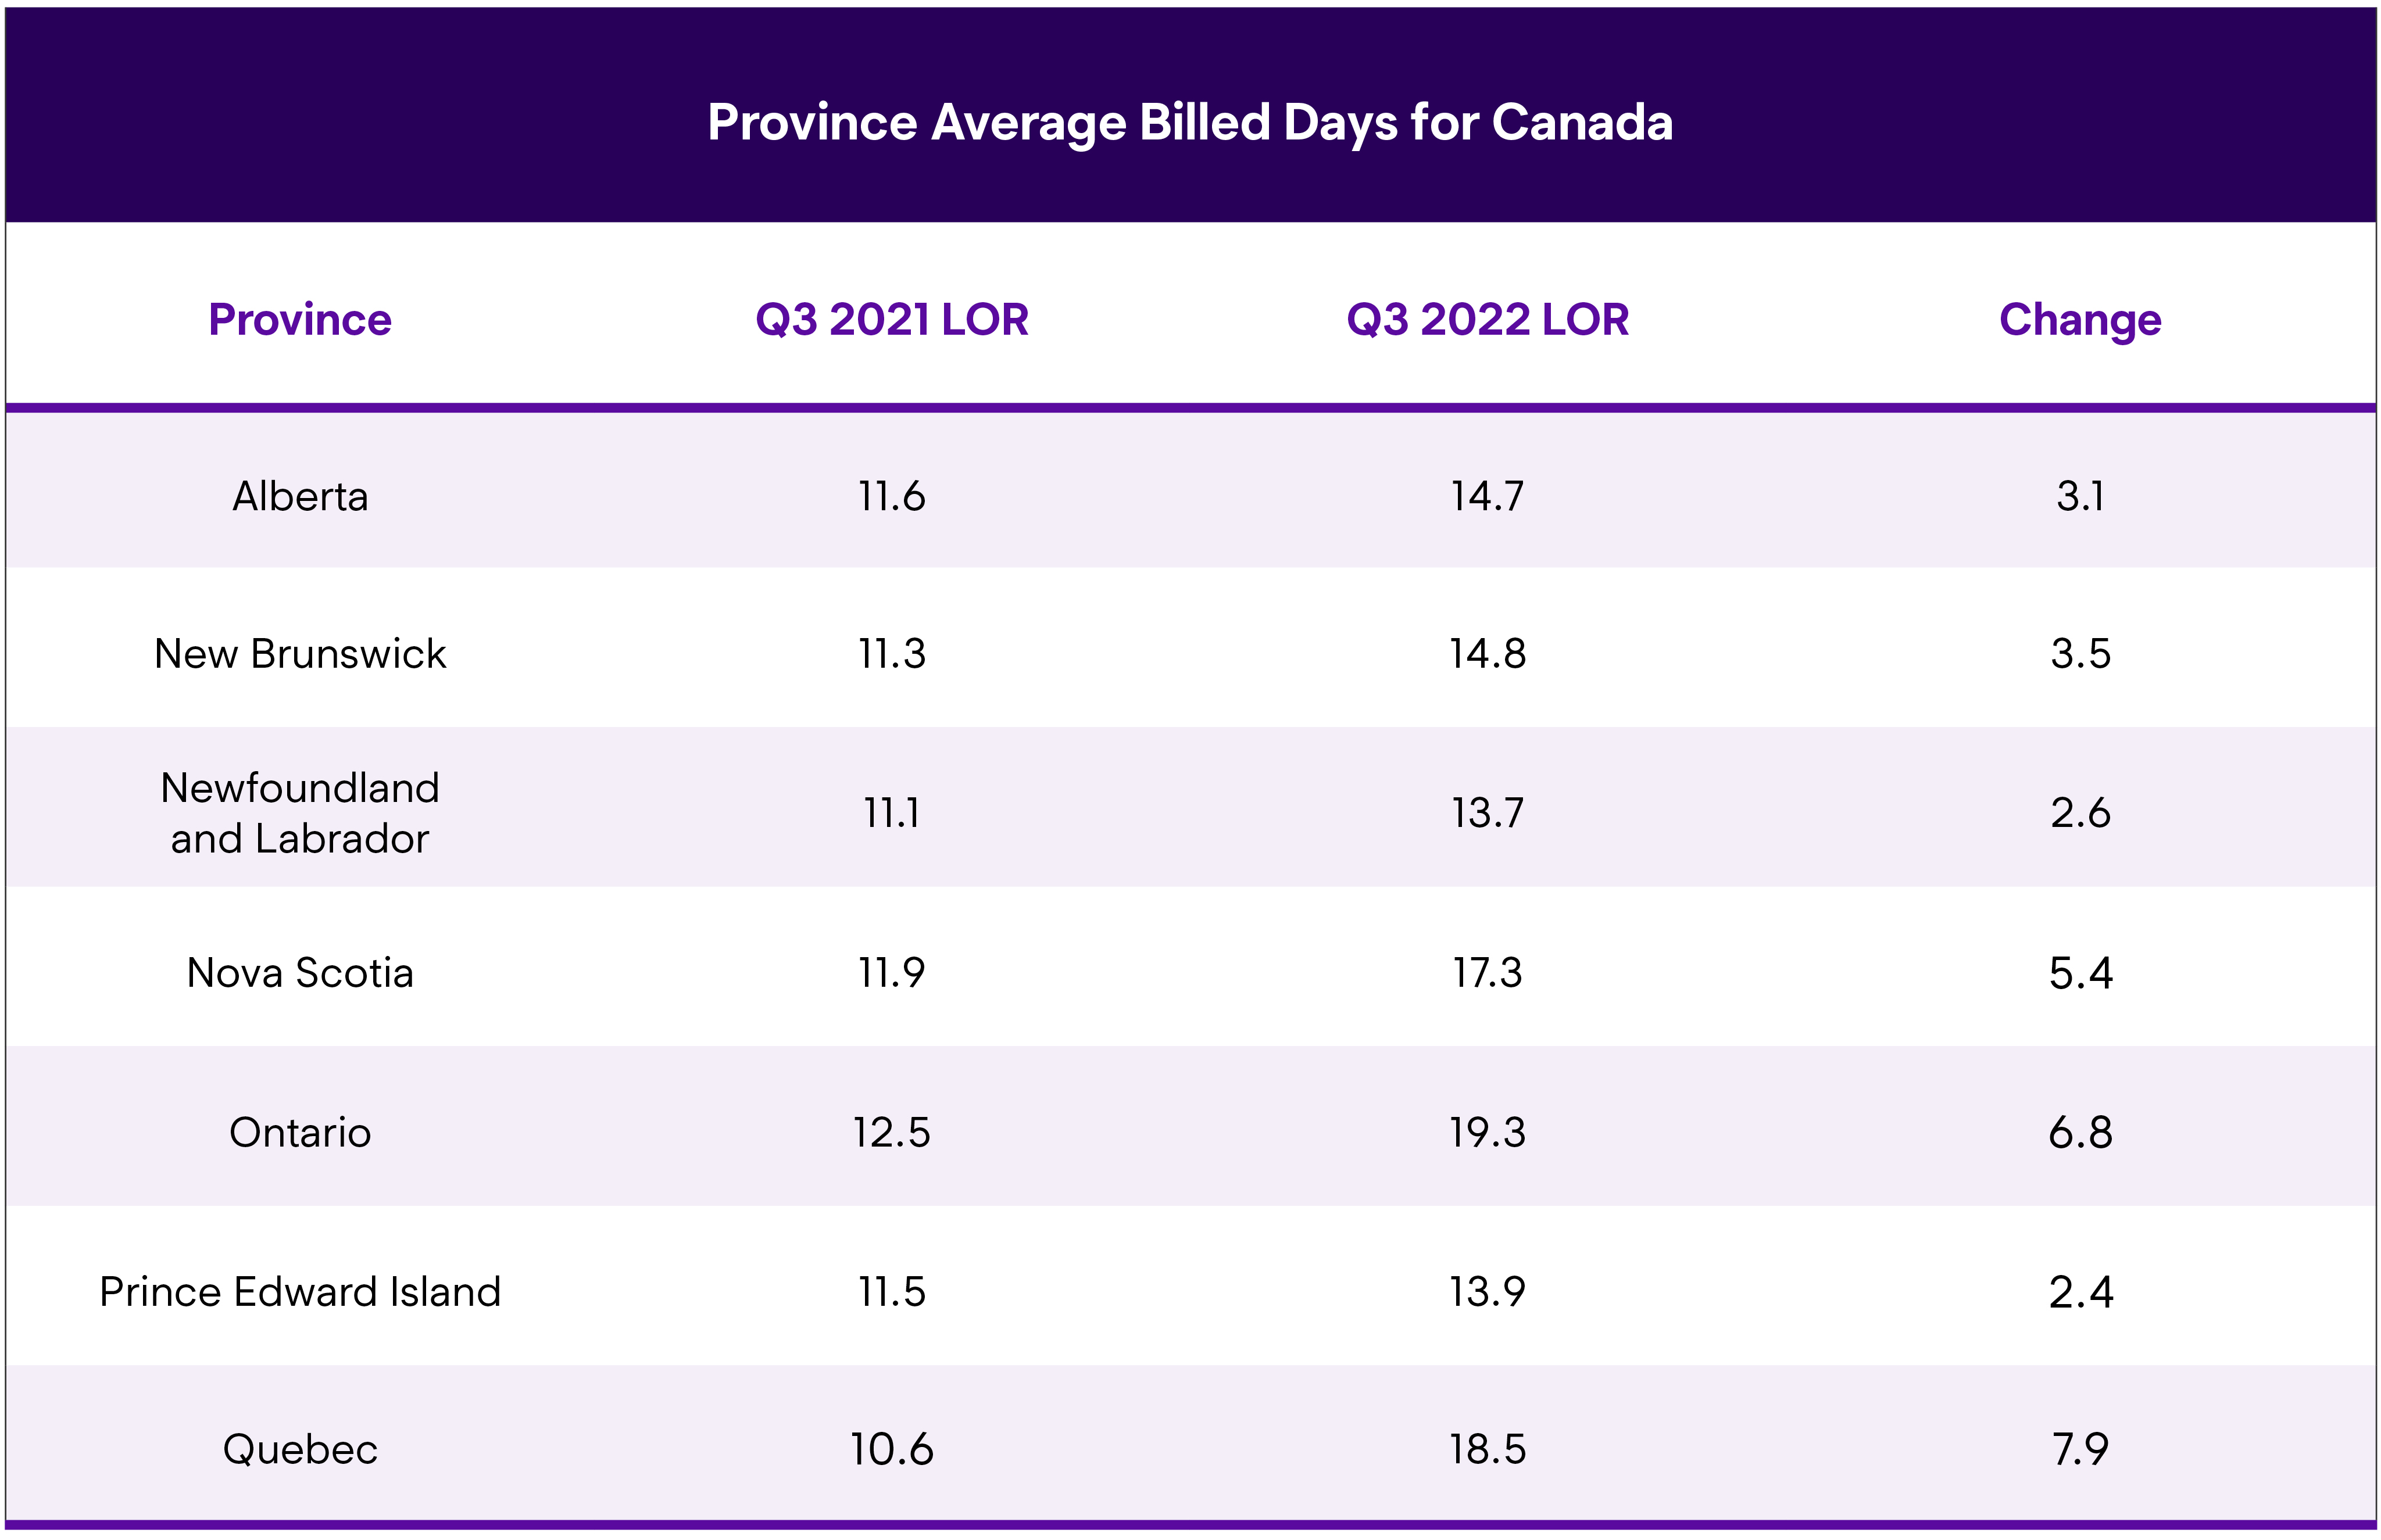
In Q3 2022, rentals associated with collision repairs averaged 16.5 days, a 5.1-day increase from Q3 2021. Ontario had the highest LOR at 19.3 days, a 6.8-day increase over Q3 2021, followed by Quebec at 18.5 days, which is up almost eight days from Q3 2021.
While all provinces saw increases, the national number was somewhat muted by Alberta’s results. Despite several July tornadoes and an impressive hailstorm in August, Alberta’s overall LOR was 14.7 days, which was a 3.1-day increase from last year. Newfoundland and Labrador had the lowest LOR at 13.7 days, followed by Prince Edward Island (PEI) at 13.9 days.
Ryan Mandell, Director of Claims Performance for Mitchell International, broke down some informational vehicle class data, saying, “Luxury vehicle frequency continues to increase with 14.56% of repairable vehicles in Q3 2022 being classified as a luxury make compared to 13.93% in Q2 2022 and 13.76% in Q3 2021. On average, we observe that from 2021-2022, luxury vehicle keys-to-keys cycle time is 2.3 days longer than common make vehicles.”
“Trucks and SUVs increased their share of repairable claims volume in Q3 2022 to 59.12%, up from 58.64% in Q2 2022 and 58.43% in Q3 2021. On average, we observe that from 2021-2022, truck/SUV keys-to-keys cycle time is 1.1 days longer than passenger cars,” said Mandell.
Seeing as results in Canada are approaching, or in some cases exceeding, the comparative U.S. results, we asked John Yoswick, Editor of the weekly U.S. CRASH Network newsletter, to offer some findings around staffing, parts availability and repair backlogs. He said, “a CRASH Network survey in June of U.S. repair shops found the vast majority (85%) are currently looking to fill at least one position in their facility, up from 79% a year ago. Body technicians, including helpers, remain the most needed positions in shops. Most shops (67%) are currently searching for at least one body technician (up 5 percentage points from three years ago, pre-pandemic) and 38% of shops are looking to hire a body helper (up 7 percentage points from both a year ago and three years ago).”
Yoswick added some additional insights, “More than 400 shops responded to the backlog survey questions, with fully 85% of those shops scheduling out two weeks or more. Only one in 100 shops said they have no backlog and can schedule new work in immediately; only two regions in the country had an average backlog of less than a month.”
Drivable
Canada’s drivable LOR was 11.9 days, up 2.8 days from Q3 2021. Ontario had the longest drivable LOR at 14.4 days, which was also the highest year-over-year increase at 4.4 days. Prince Edward Island recorded the lowest at 8.4 days, which was a half-day drop from Q3 2021. New Brunswick (8.8 days) and Newfound and Labrador (9.4) were the next lowest.
Non-Drivable
The largest impact to LOR in Canada has been with non-drivable claims. In Q3 2022, LOR was 31.4 days, an increase of 12.8 days from Q3 2021. In comparison, the U.S. average LOR for non-drivable rentals was 27.2 days, which was up 5.3 days from Q3 2021. PEI’s non-drivable LOR was 39.1 days, followed by Nova Scotia at 37.6 days—these were increases of 19.1 and 19.0 days, respectively. Ontario’s LOR was 33.7 days, with only Alberta (29.1) and Quebec (26.9) coming in under 30 days total.
Mandell observed, “non-drivable vehicles continue to be more prevalent with 16.02% of repairable vehicles being classified as such in Q3 2022 compared to 15.81% in Q2 2022 and 15.8% in Q3 2021.”
The repair backlog that Yoswick and CRASH Network noted earlier have an outsized impact on non-drivable repairs. Yoswick noted, “Shops continue to struggle with high levels of work-in-progress (WIP): jobs stalled because of parts delays or other issues or non-drivable vehicles waiting in the queue.” Yoswick added, “Among 350 shops responding to CRASH Network’s “Business Perspectives” survey in September, the average shop repairs 80 cars per month and currently has 51 jobs in process, or 64% of their typical monthly volume. Although that is only slightly higher than the average 62% work-in-progress the same survey found in June, it signals that most shops continue to be loaded up with work waiting to be completed.”
“Overall, nine out of 10 shops have 24% or more of their monthly volume in process, but one in four shops have 80% or more of their monthly volume in process, and one in 10 are approaching 120%,” Yoswick concluded.
Total Loss Claims
Total Loss LOR was 23.8 days in Q3 2022. New Brunswick’s LOR was the highest at 30.7 days, while Newfoundland and Labrador was lowest at 17.7 days. New Brunswick’s results represent an increase of 15.5 days over Q3 2021, which is the largest year-over-year increase. Quebec’s Q3 LOR was 11.7 days higher, coming in at 26.3 days, while Ontario’s mark of 25.1 days was 8.7 days higher than Q3 2021.
When asked about repairability and total loss mixes, Mandell observed, “Overall repairable volume grew by 0.64% in Q3 2022 compared to Q2 2022 and by 11.16% compared to Q3 2021. The increase in repairable volume is not only being driven by growth in kilometers traveled but also by the lower relative frequency of total loss outcomes due to higher vehicle ACVs. Total Loss frequency stands at 15.7% in Q3 2022, up only slightly from 15.6% in Q2 2022 but down significantly from 19.3% in Q3 2021.”
Summary
The results for the third quarter of this year are significant, as it appears many of the factors affecting everyone in the collision industry—including technician staffing, ever-changing parts availabilities, new and used vehicle pricing, inflationary pressures, and new claims processes—are becoming prevalent. The entire industry will play a part in ensuring all collision-related businesses are aligned, not just to offer procedural solutions, but to ensure our mutual customers receive safe and proper repairs, an excellent experience, and peace of mind.
Data excludes the private carrier provinces of British Columbia, Manitoba and Saskatchewan.
Enterprise remains steadfastly committed to working with its insurer, repairer, and supplier partners across Canada to coordinate information and evaluate current processes affecting LOR. Through foundational support provided by the Enterprise Holdings Foundation, Enterprise is spearheading the Collision Engineering Program in the U.S., in partnership with Ranken Technical College, to attract and develop entry-level talent to fill essential roles within the collision repair industry. For more information, visit beacollisionengineer.com.