


Ryan Mandell
Vice President, Strategy & Market Intelligence
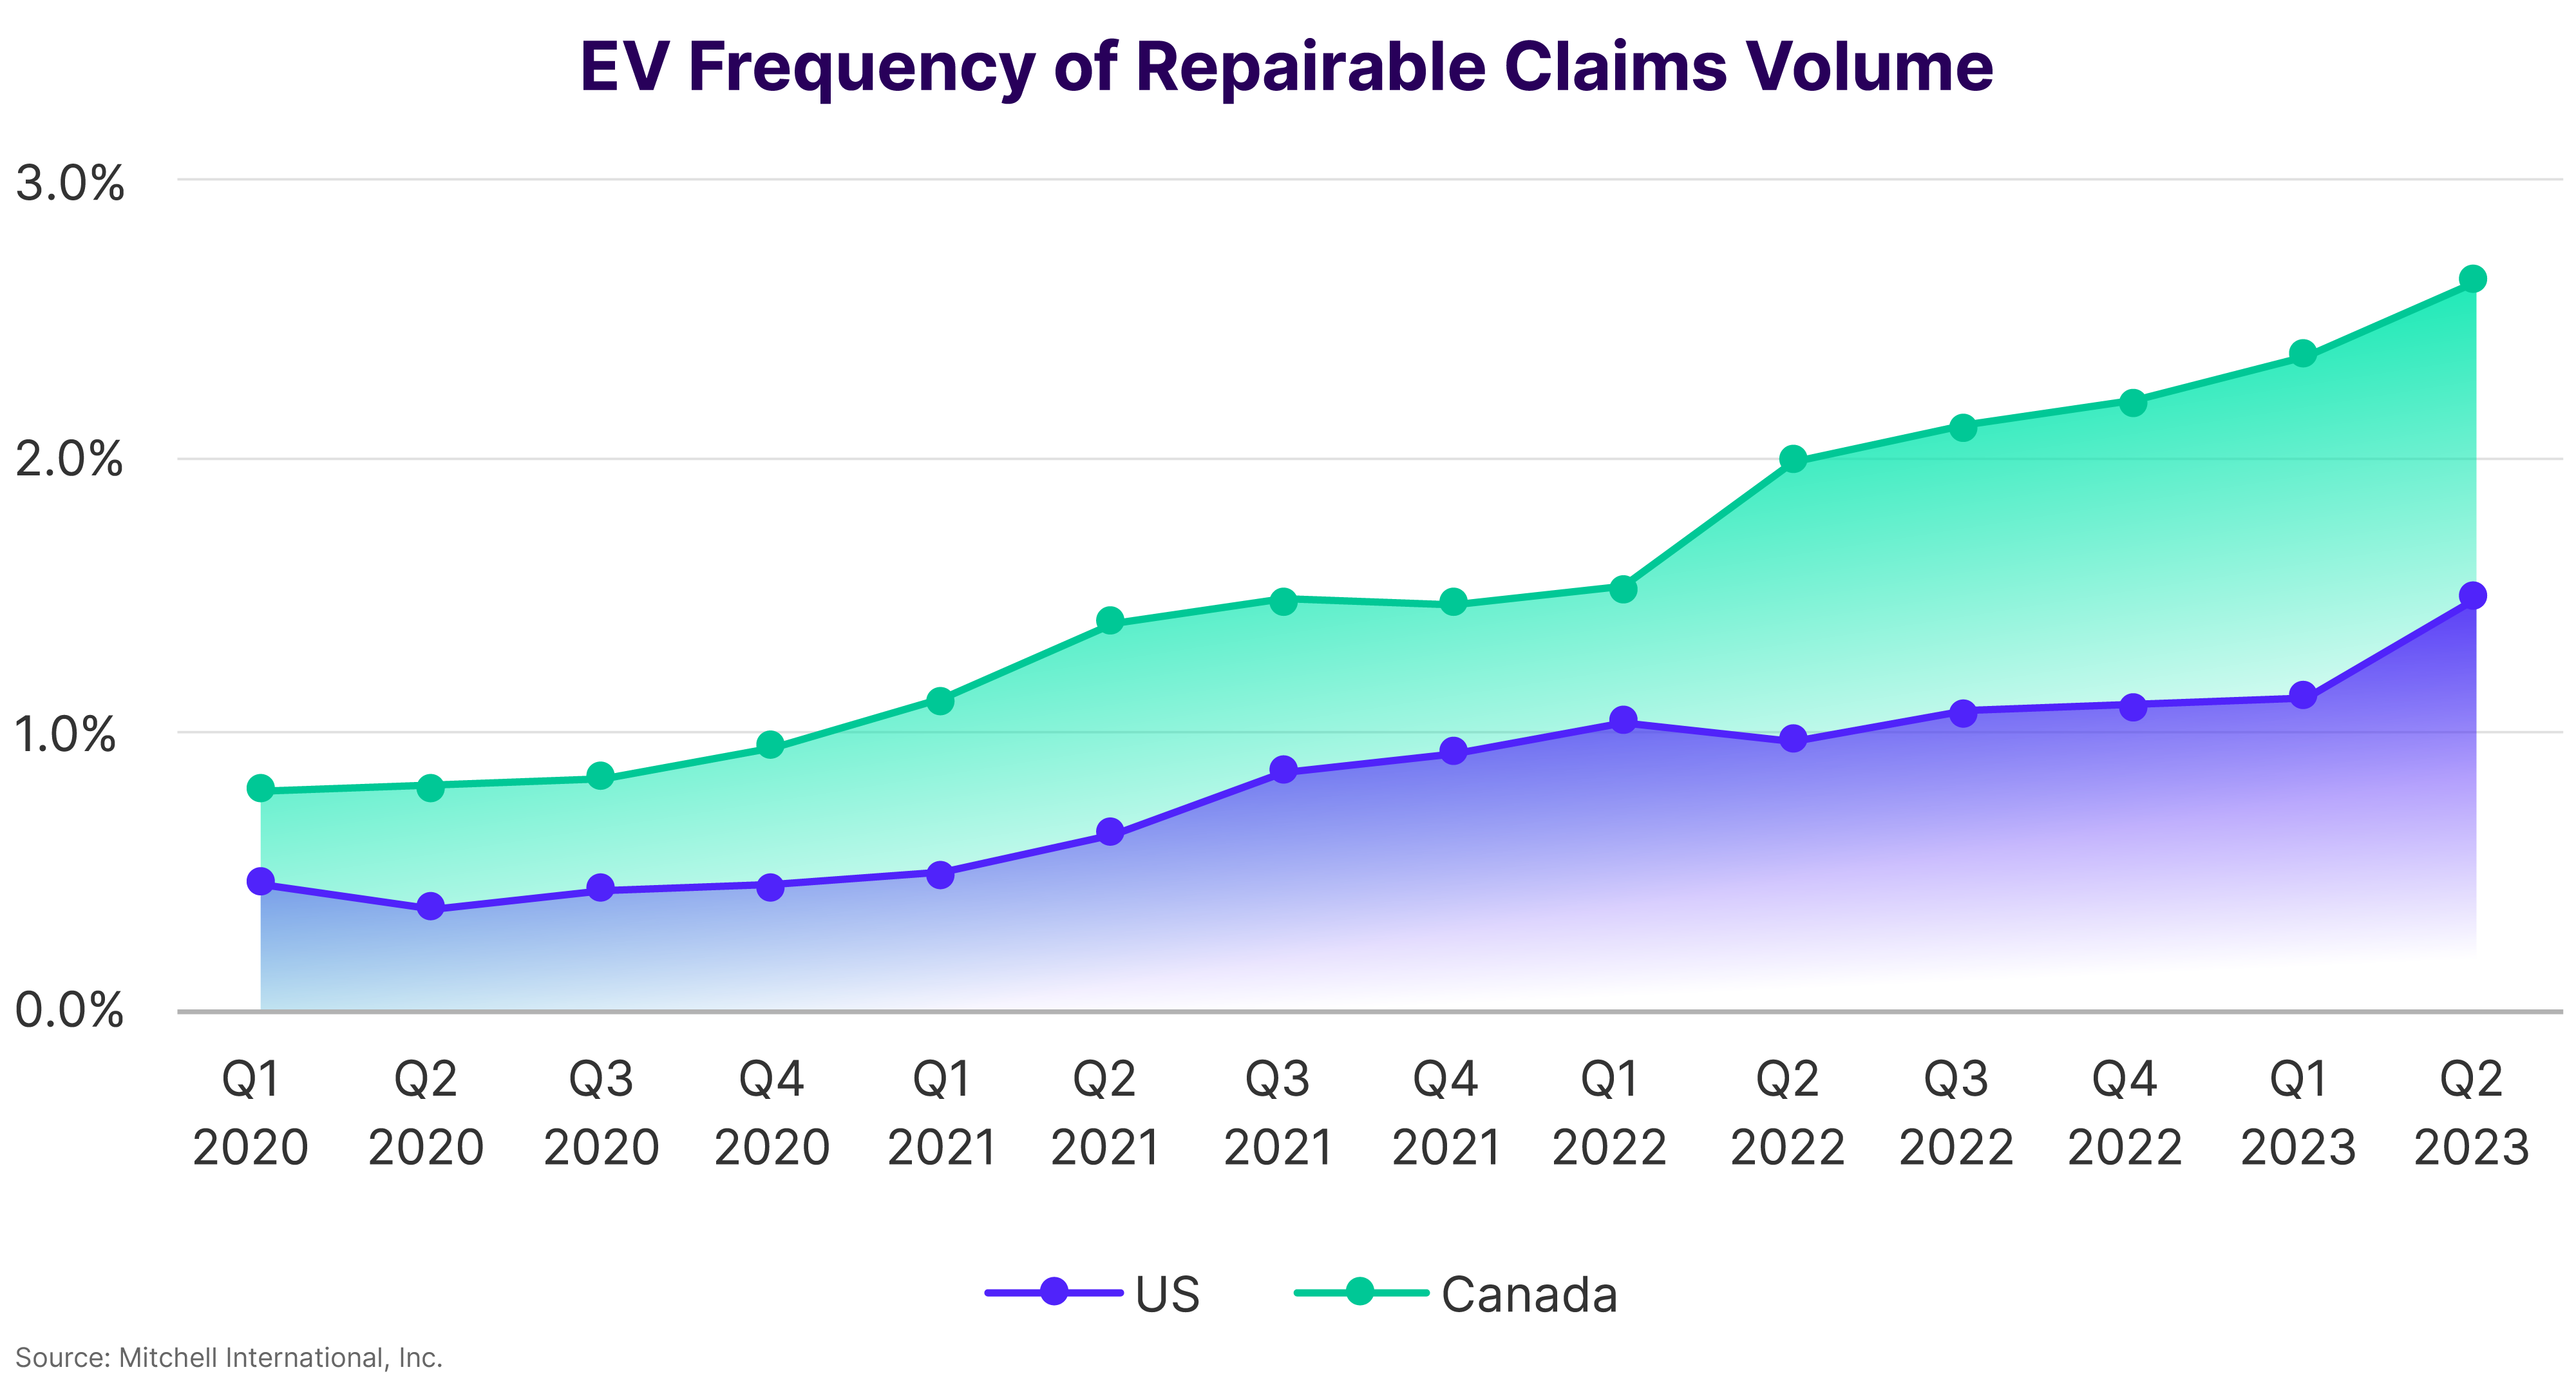
Electric vehicle (EV) repairable claims frequency rose to 1.49% in the US and 2.64% in Canada in Q2 2023, which is an increase of 0.36% and 0.23% respectively over Q1. Tesla, the largest EV manufacturer in the world, saw its U.S. market share of repairable vehicles fall to 74.57% of all EVs repaired. This is down from 75.8% in Q1 2023, signaling that ongoing growth in the number of available EV models is affecting the types of vehicles repaired in collision facilities. The most notable movement was in the repairable claims frequency of the F-150 Lightning, Ford’s new battery electric light-duty truck. It saw more than double the volume in Q2 2023 compared to Q1, rising from 1.25% to 3.05% of EV repairable claims in the US. In Canada, however, Tesla’s market share actually increased to 70.67%, up from 67.87% in Q1, with the Model S reappearing in the top 5 list of most frequently repaired EVs in the country.
Analysis of Q2 2023 claims data shows that EVs tend to be designated non-drivable at a lower frequency than their internal combustion engine (ICE) counterparts. In Q2 2023, only 10.31% of EVs were classified as non-drivable compared to 13.11% of ICE vehicles. The relative lack of moving parts means that an EV’s critical powertrain is less likely to be compromised during an accident. While certain ADAS components may be disrupted due to an advanced level of interconnectivity, the vehicle still has a higher likelihood of remaining drivable. EVs are, however, more apt to be considered non-drivable after a rear-end impact (10.87%) than ICE automobiles (9.72%). This is primarily due to the presence of powertrain components in the rear of the vehicle—such as an electric motor—that are lacking in ICE automobile design.
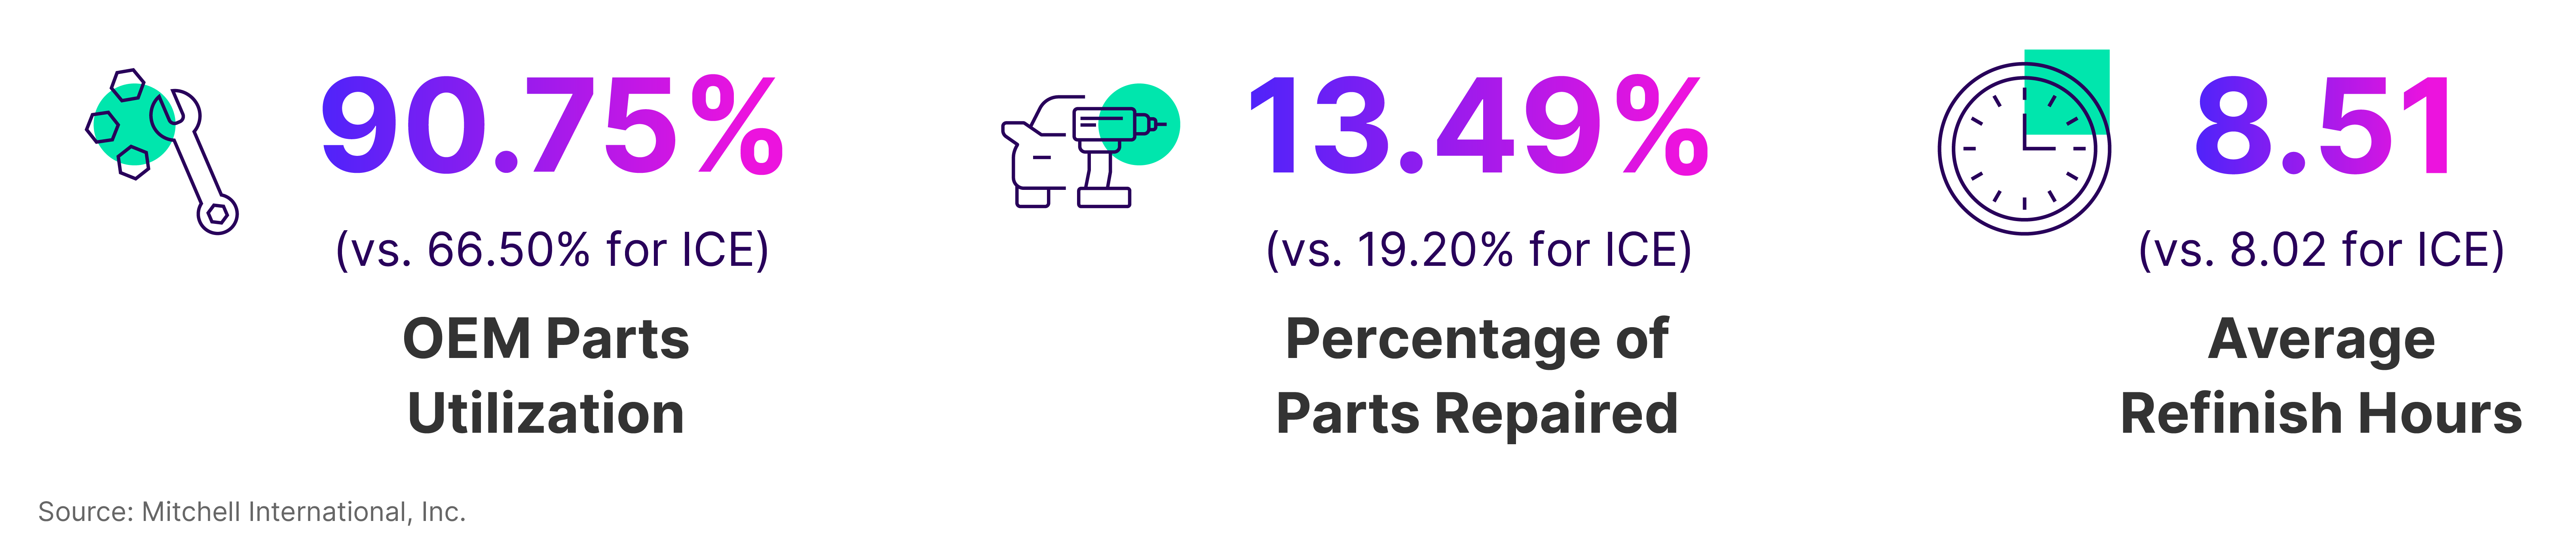
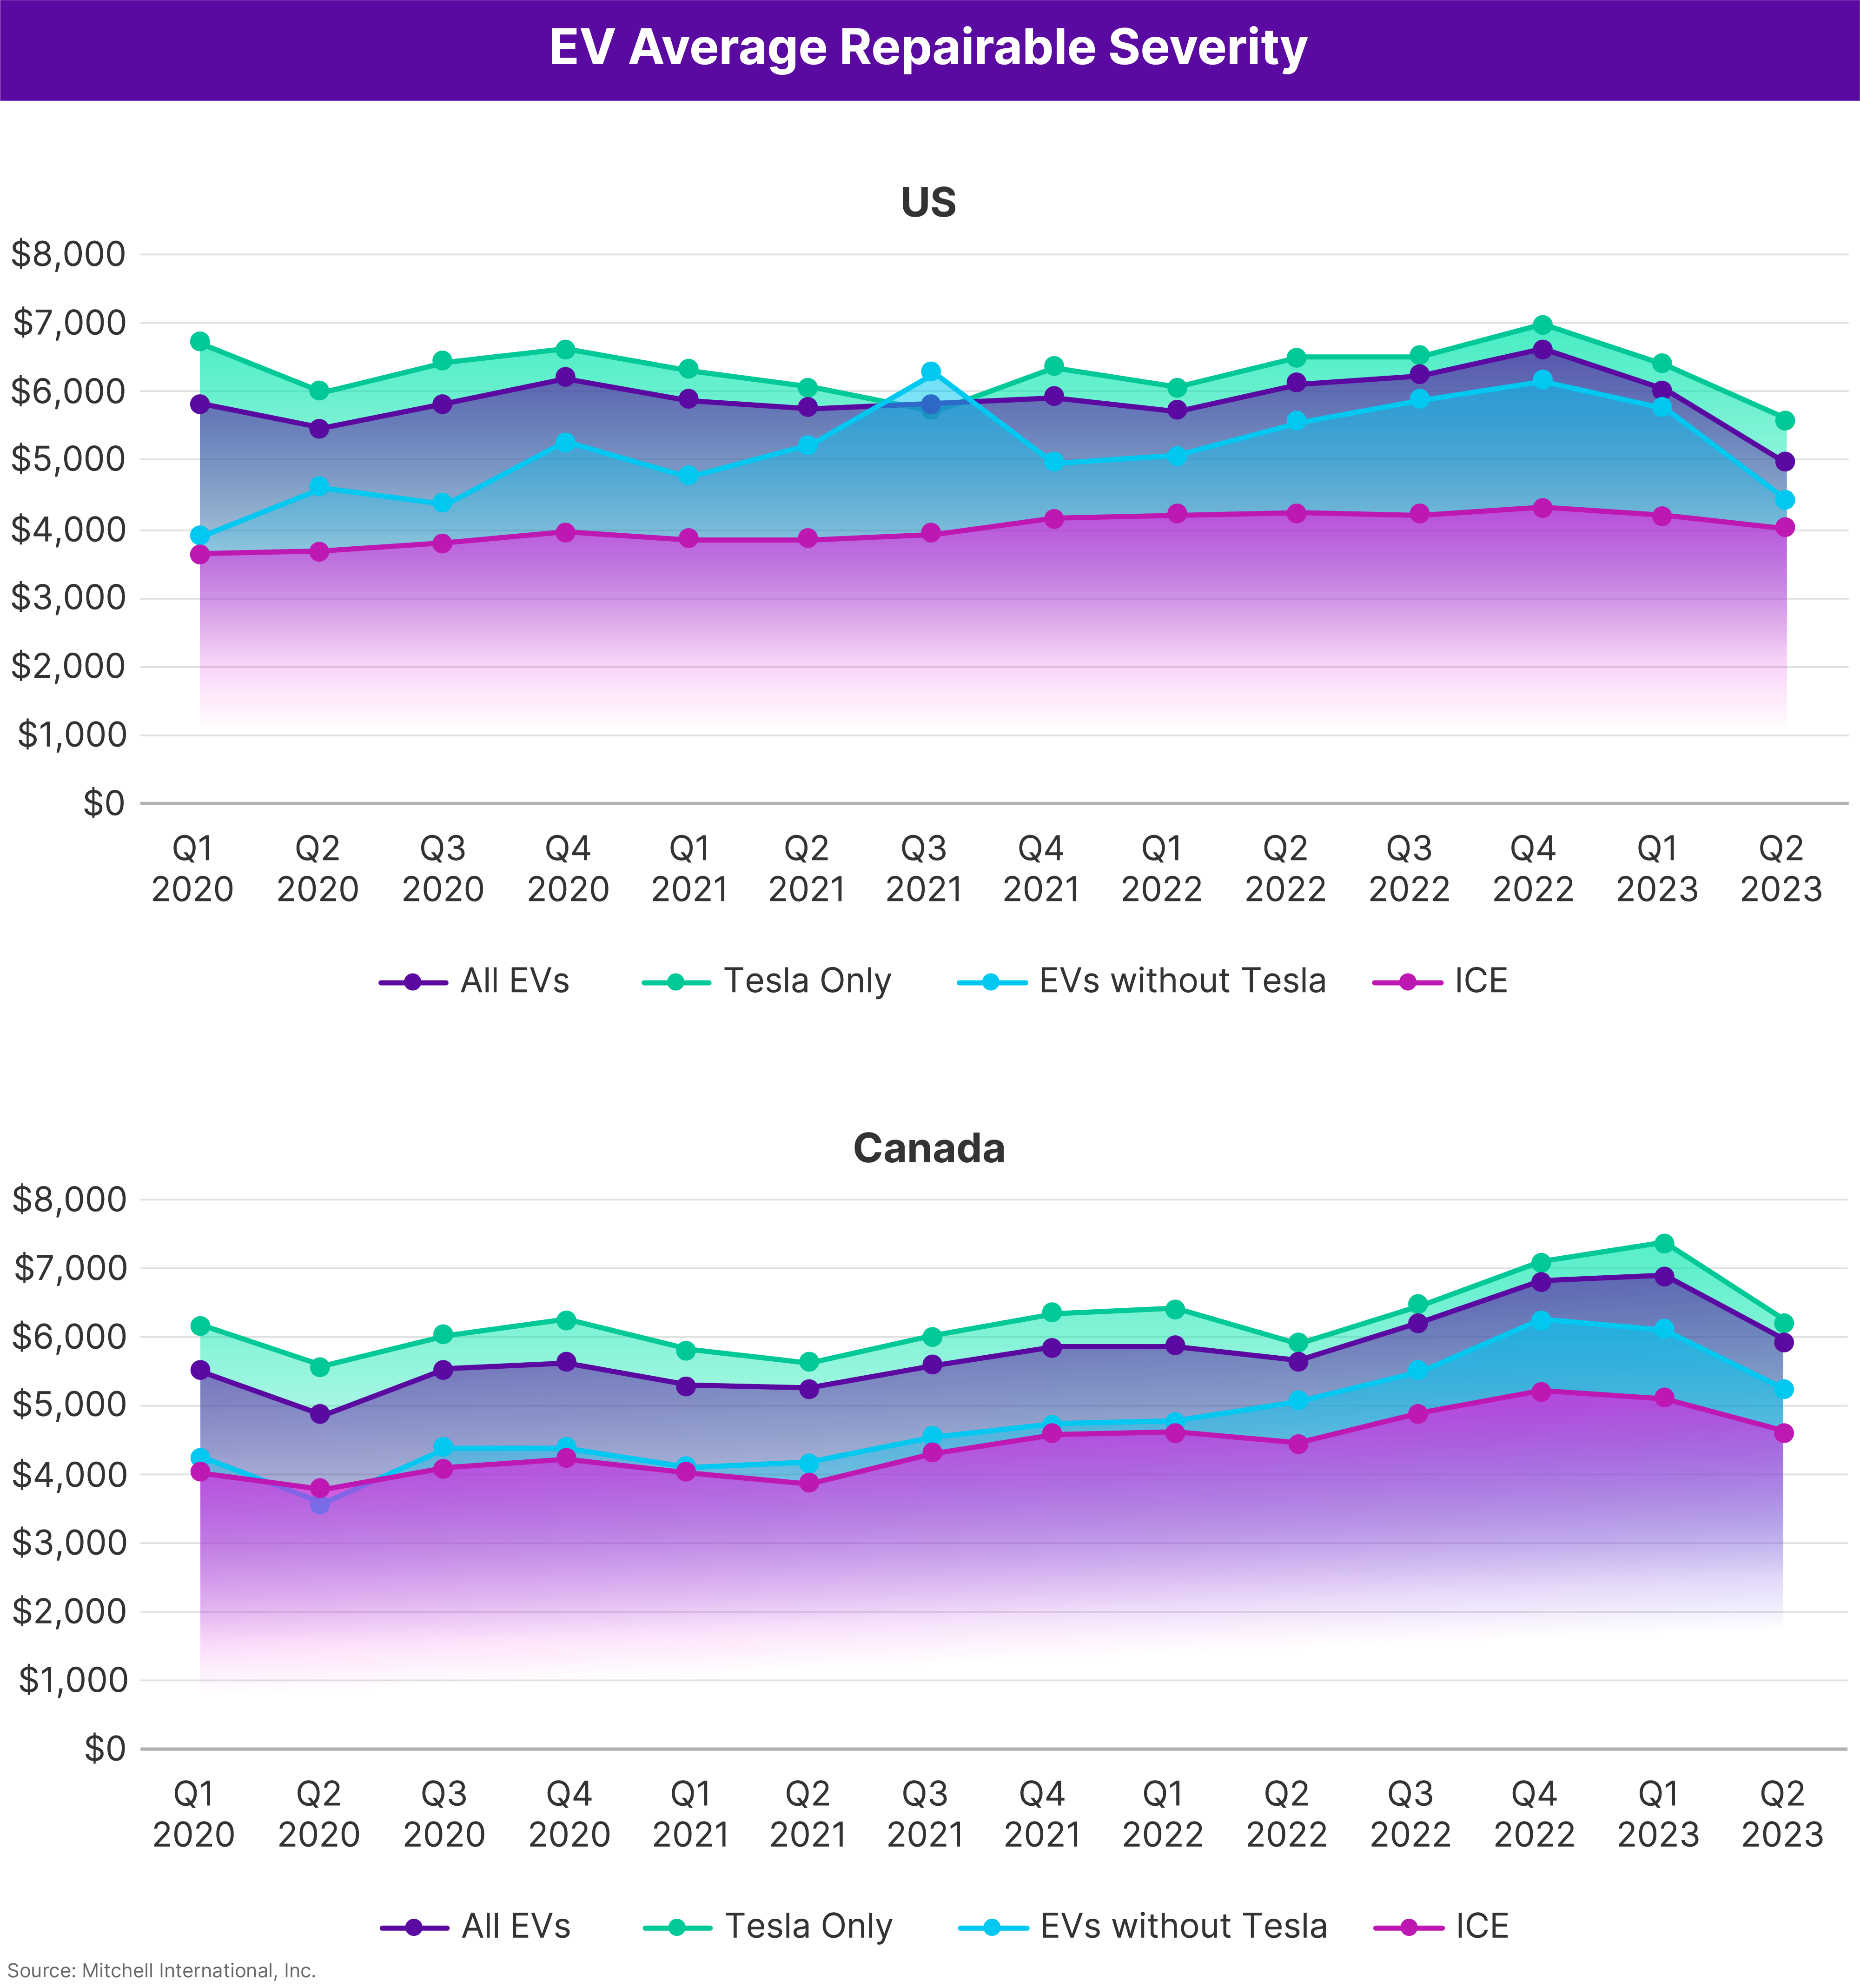
As it relates to average severity for repairable vehicles, EV costs continue to exceed those of ICE automobiles. For Q2 2023, severity costs were higher for EVs by $963 in the US and $1,328 in Canada. However, when looking at just Teslas compared to ICE vehicles, the cost differential jumps to $1,589 and $1,600 respectively in each region. OEM parts utilization and average refinish hours also remain higher for EVs (by 24.25% and 0.49 hours in Q2) while the percentage of parts repaired is lower (by 5.71%) than for ICE-powered alternatives.
As it relates to average severity for repairable vehicles, EV costs continue to exceed those of ICE automobiles. For Q2 2023, severity costs were higher for EVs by $963 in the US and $1,328 in Canada.
The recently released EY 2023 Mobility Consumer Index showed a dramatic increase in the number of U.S. consumers (48% or nearly half) considering an EV or plug-in hybrid for their next vehicle purchase (up from 29% in 2022). GM reported that sales of the Chevy Bolt more than doubled in Q2 2023 compared to Q2 2022. In addition, both Tesla and Rivian reported a record number of vehicles delivered during the second quarter as well. Automakers continue to push toward a more electrified future with an ever-broadening lineup of EV offerings. For example, Stellantis—having found success with the Jeep 4xe platform—recently announced the release of the Jeep Avenger. The Avenger is the first full EV in the manufacturer’s lineup to make its debut and the first of four different EV platforms the company plans to use to reach its goal of 50% EV sales in the US by 2030.
By the Numbers
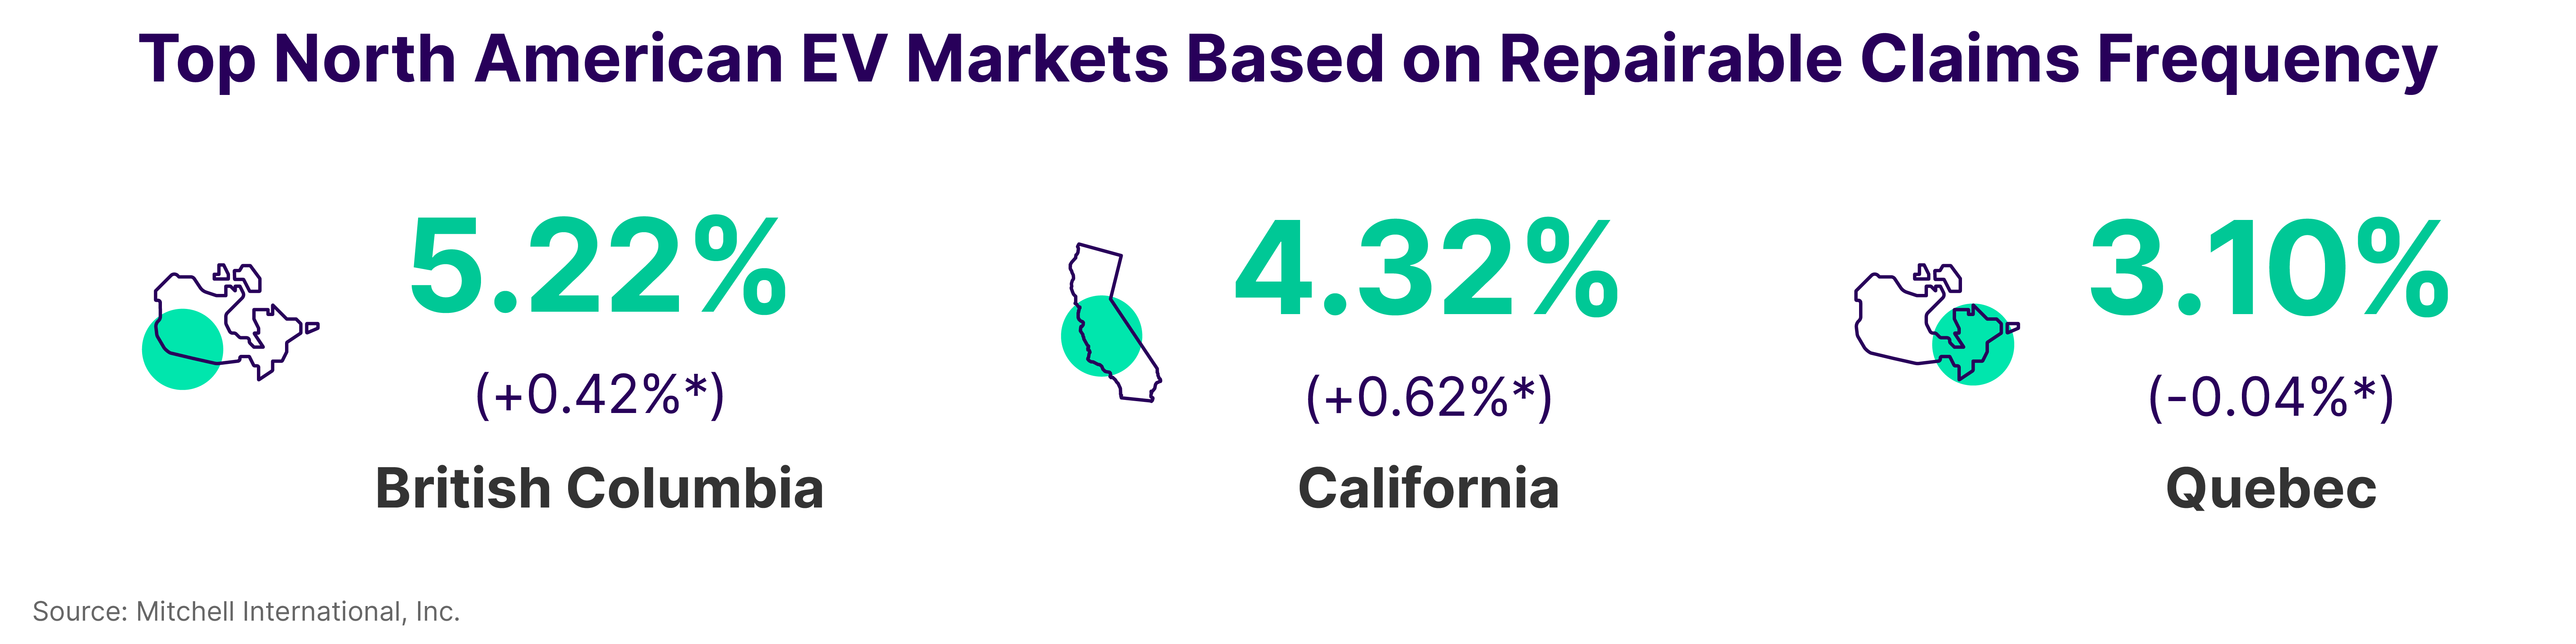
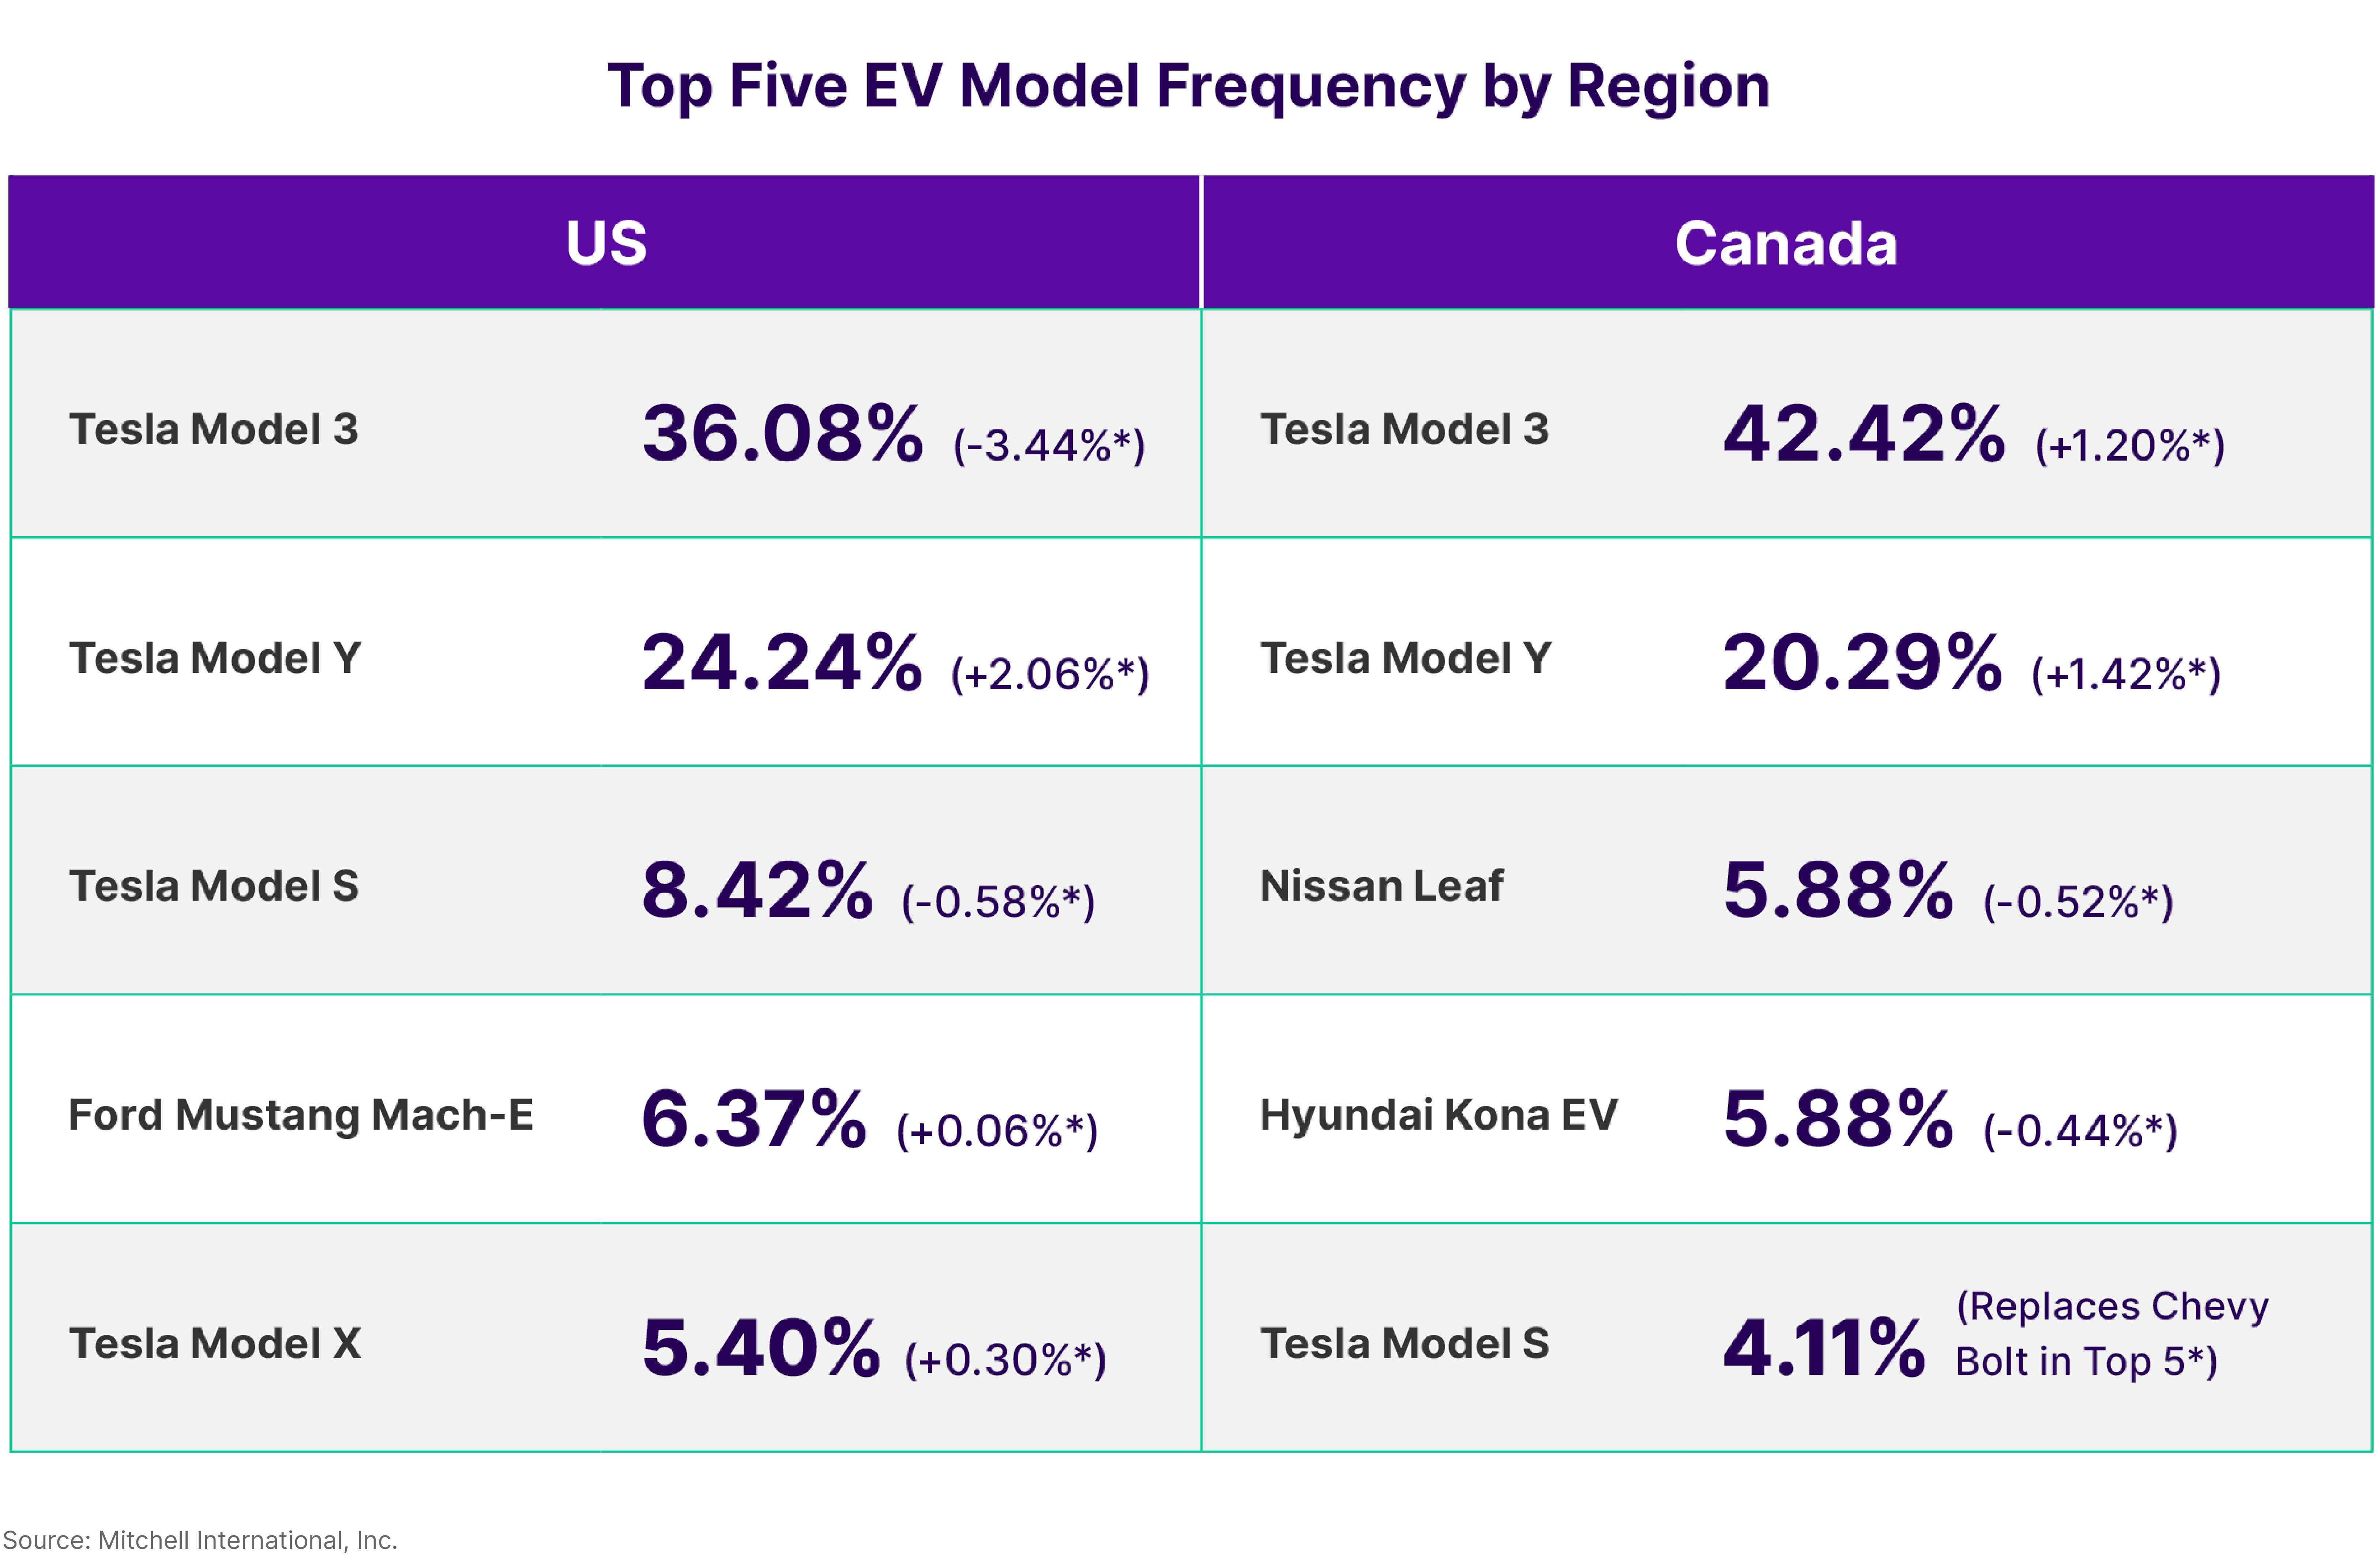
*Difference between Q2 2023 and Q1 2023.
Subscribe Now
To subscribe to future issues of Mitchell's Plugged-In: EV Collision Insights report, please complete the form below.