

Plugged-In: EV Collision Insights 2025 Year in Review

Ryan Mandell
Vice President, Strategy & Market Intelligence
After several years of steady growth, the battery electric vehicle (BEV) market experienced significant volatility in 2025. Automotive manufacturers scaled back investments—including Ford with its F-150 Lightning end of production announcement—and the U.S. and Canada rescinded tax credits designed to boost consumer demand for BEVs. While brands like GM, Honda and Volkswagen experienced modest BEV sales gains, overall adoption slowed. In the U.S., BEV purchases declined by approximately 2% from 2024 and with more electrified alternatives, Tesla’s market share also dropped to 46.2% from 48.7% in 2024. However, broader model availability and closer price parity with internal combustion engine (ICE) automobiles resulted in record mild hybrid electric vehicle (MHEV) sales, which increased by 28% in the U.S. (Canadian sales data was not available at the time of publication).
Vehicle values declined across most powertrain options in 2025, with BEVs experiencing the largest decrease at 6.44% year over year in the U.S. ($30,126 in 2024 vs. $28,185 in 2025) and 12.62% in Canada ($41,775 in 2024 vs. $36,504 in 2025). This was driven by accelerated depreciation, increased availability of lower-cost models and shifting consumer sentiment. By comparison, ICE vehicle values declined more modestly, dropping 2.55% in the U.S. ($14,241 in 2024 vs. $13,887 in 2025) and 6.12% in Canada ($17,049 in 2024 vs. $16,005 in 2025). On the other hand, hybrid values (both MHEVs and plug-in hybrid electric vehicles, or PHEVs) rose 4.18% in the U.S. ($18,453 in 2024 vs. $19,225 in 2025) and declined 4.40% in Canada ($30,268 in 2024 vs. $28,938 in 2025).
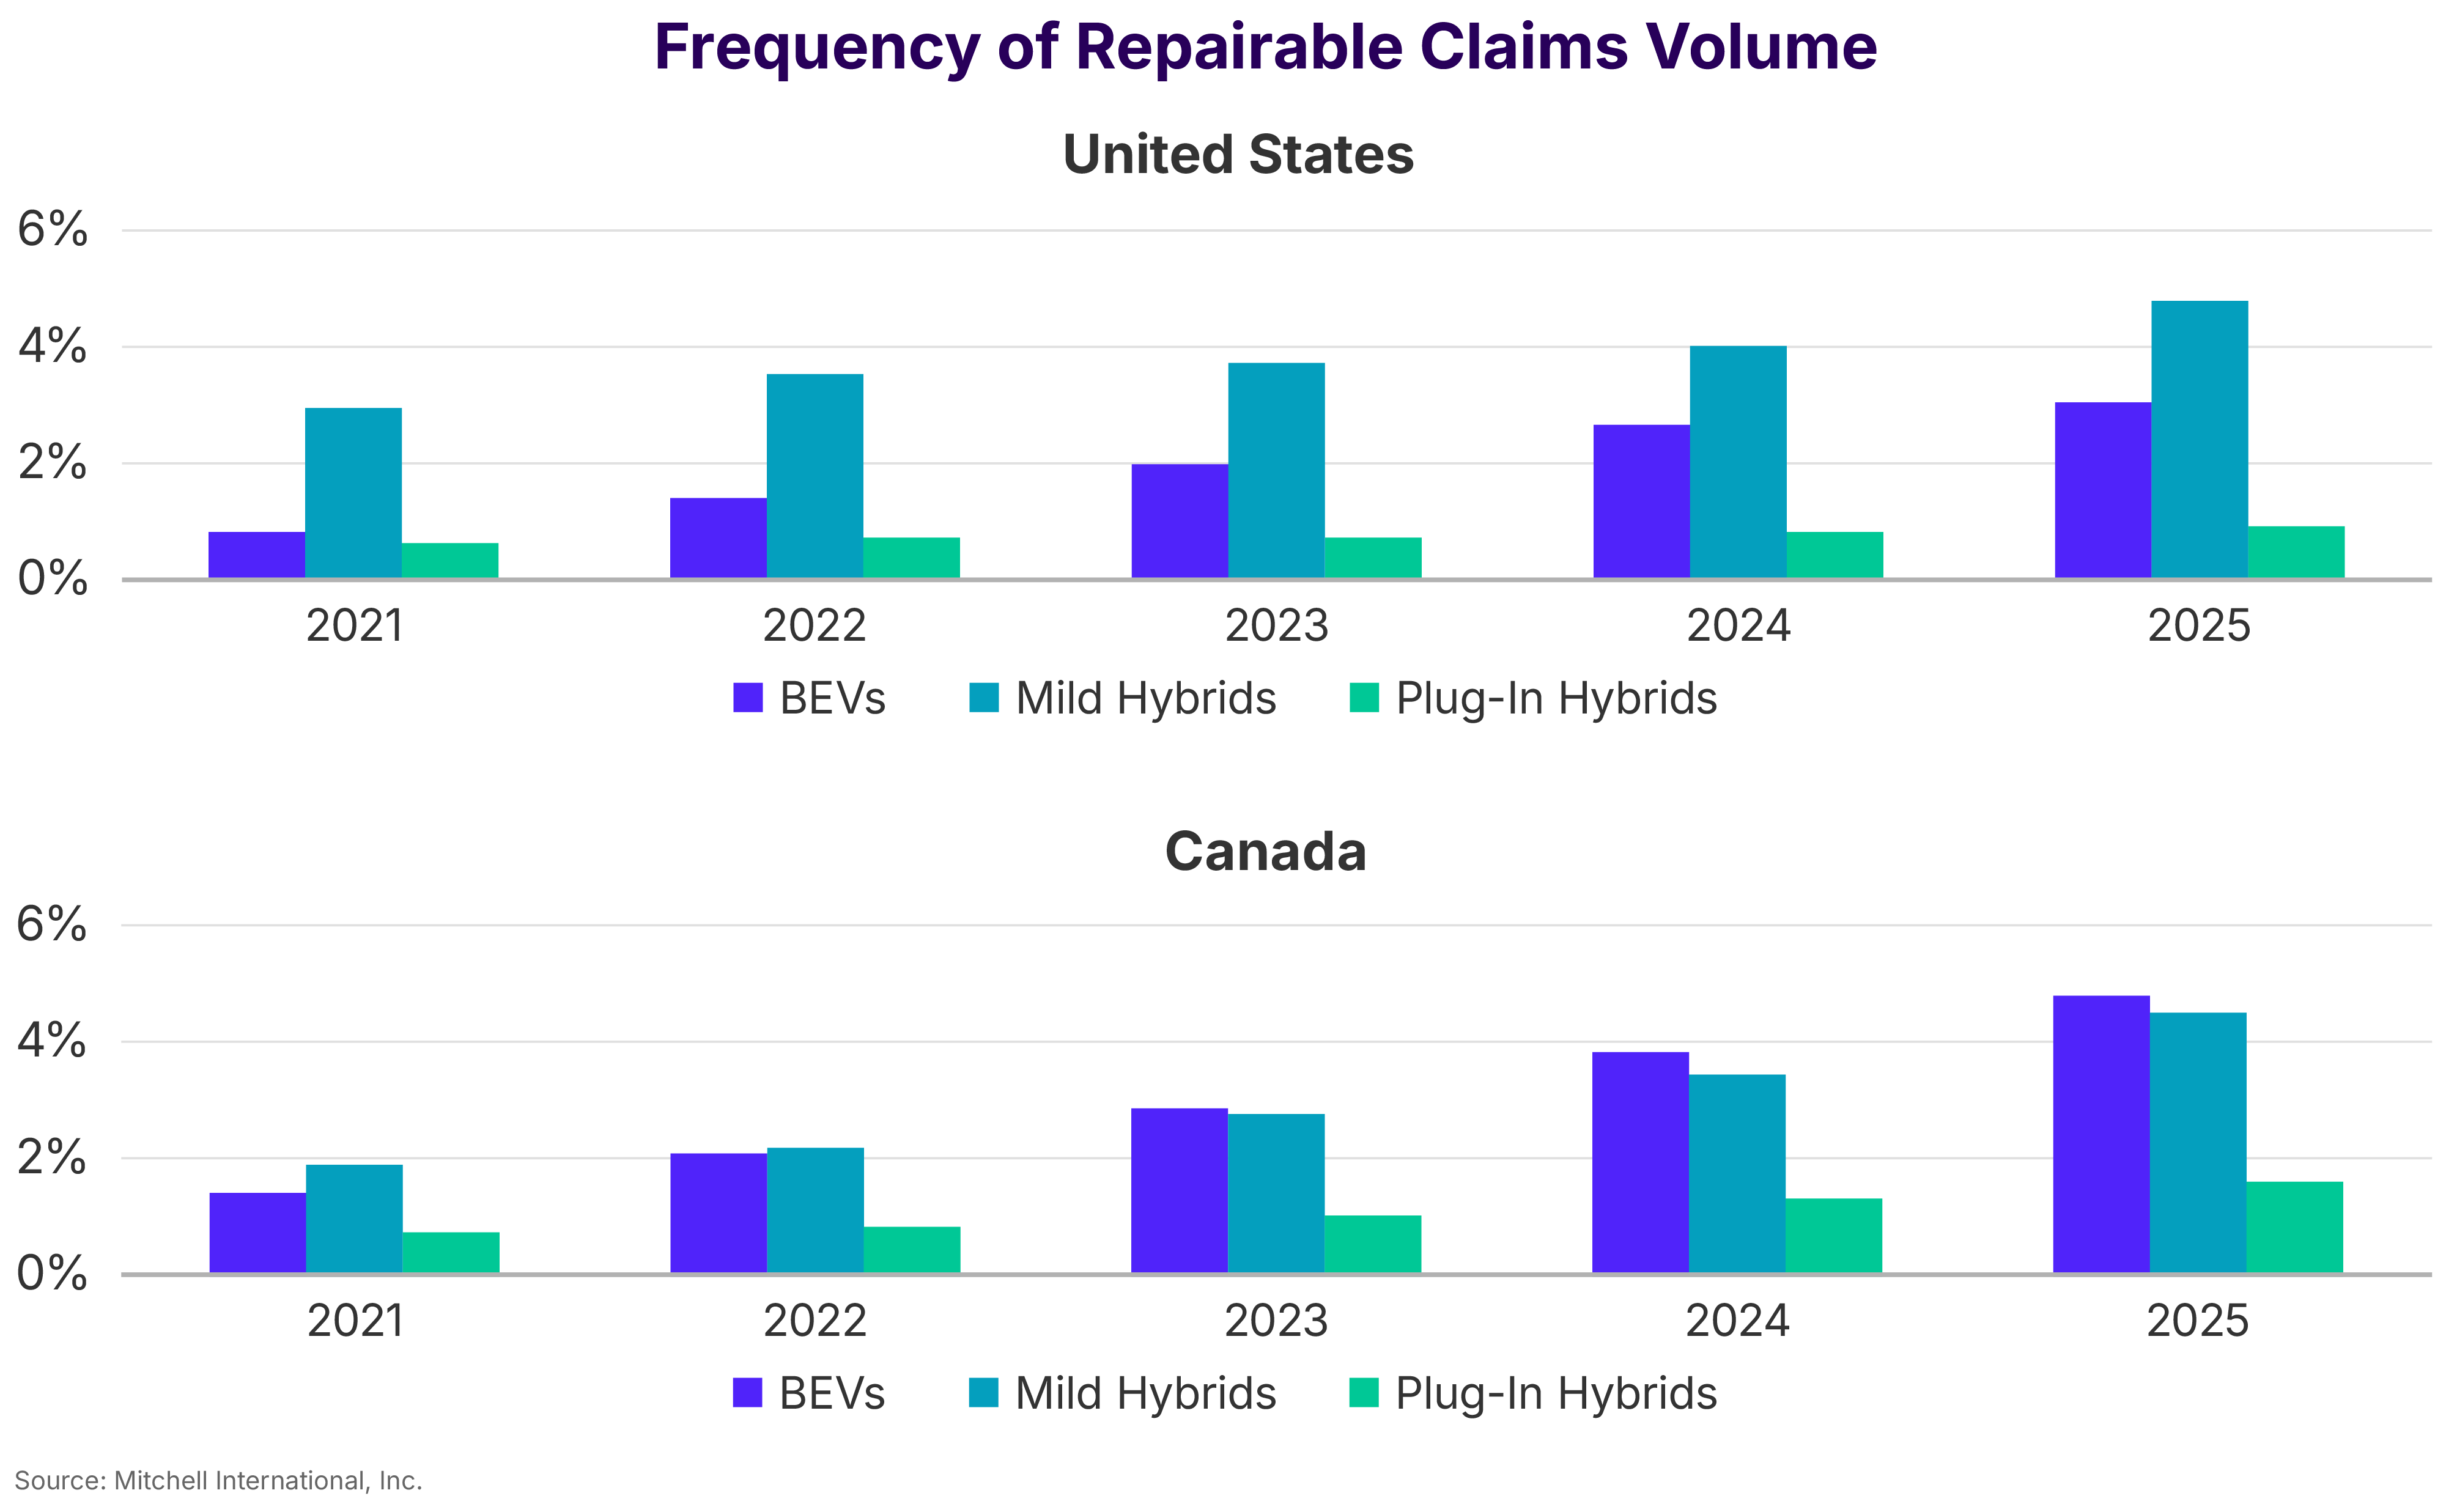
Despite slower sales growth, claims frequency for collision-damaged BEVs continues to rise with more of these electrified alternatives on the road. Last year, BEVs represented 3.07% of all repairable automobile claims in the U.S., up 14.1% from 2024. MHEVs came in at 4.82% and PHEVs at 0.89%, a 20% and 6% year-over-year increase, respectively. In Canada, repairable BEV claims were 4.77%, 4.44% for MHEVs and 1.55% for PHEVs, jumping 24%, 29% and 26% respectively in the last 12 months.
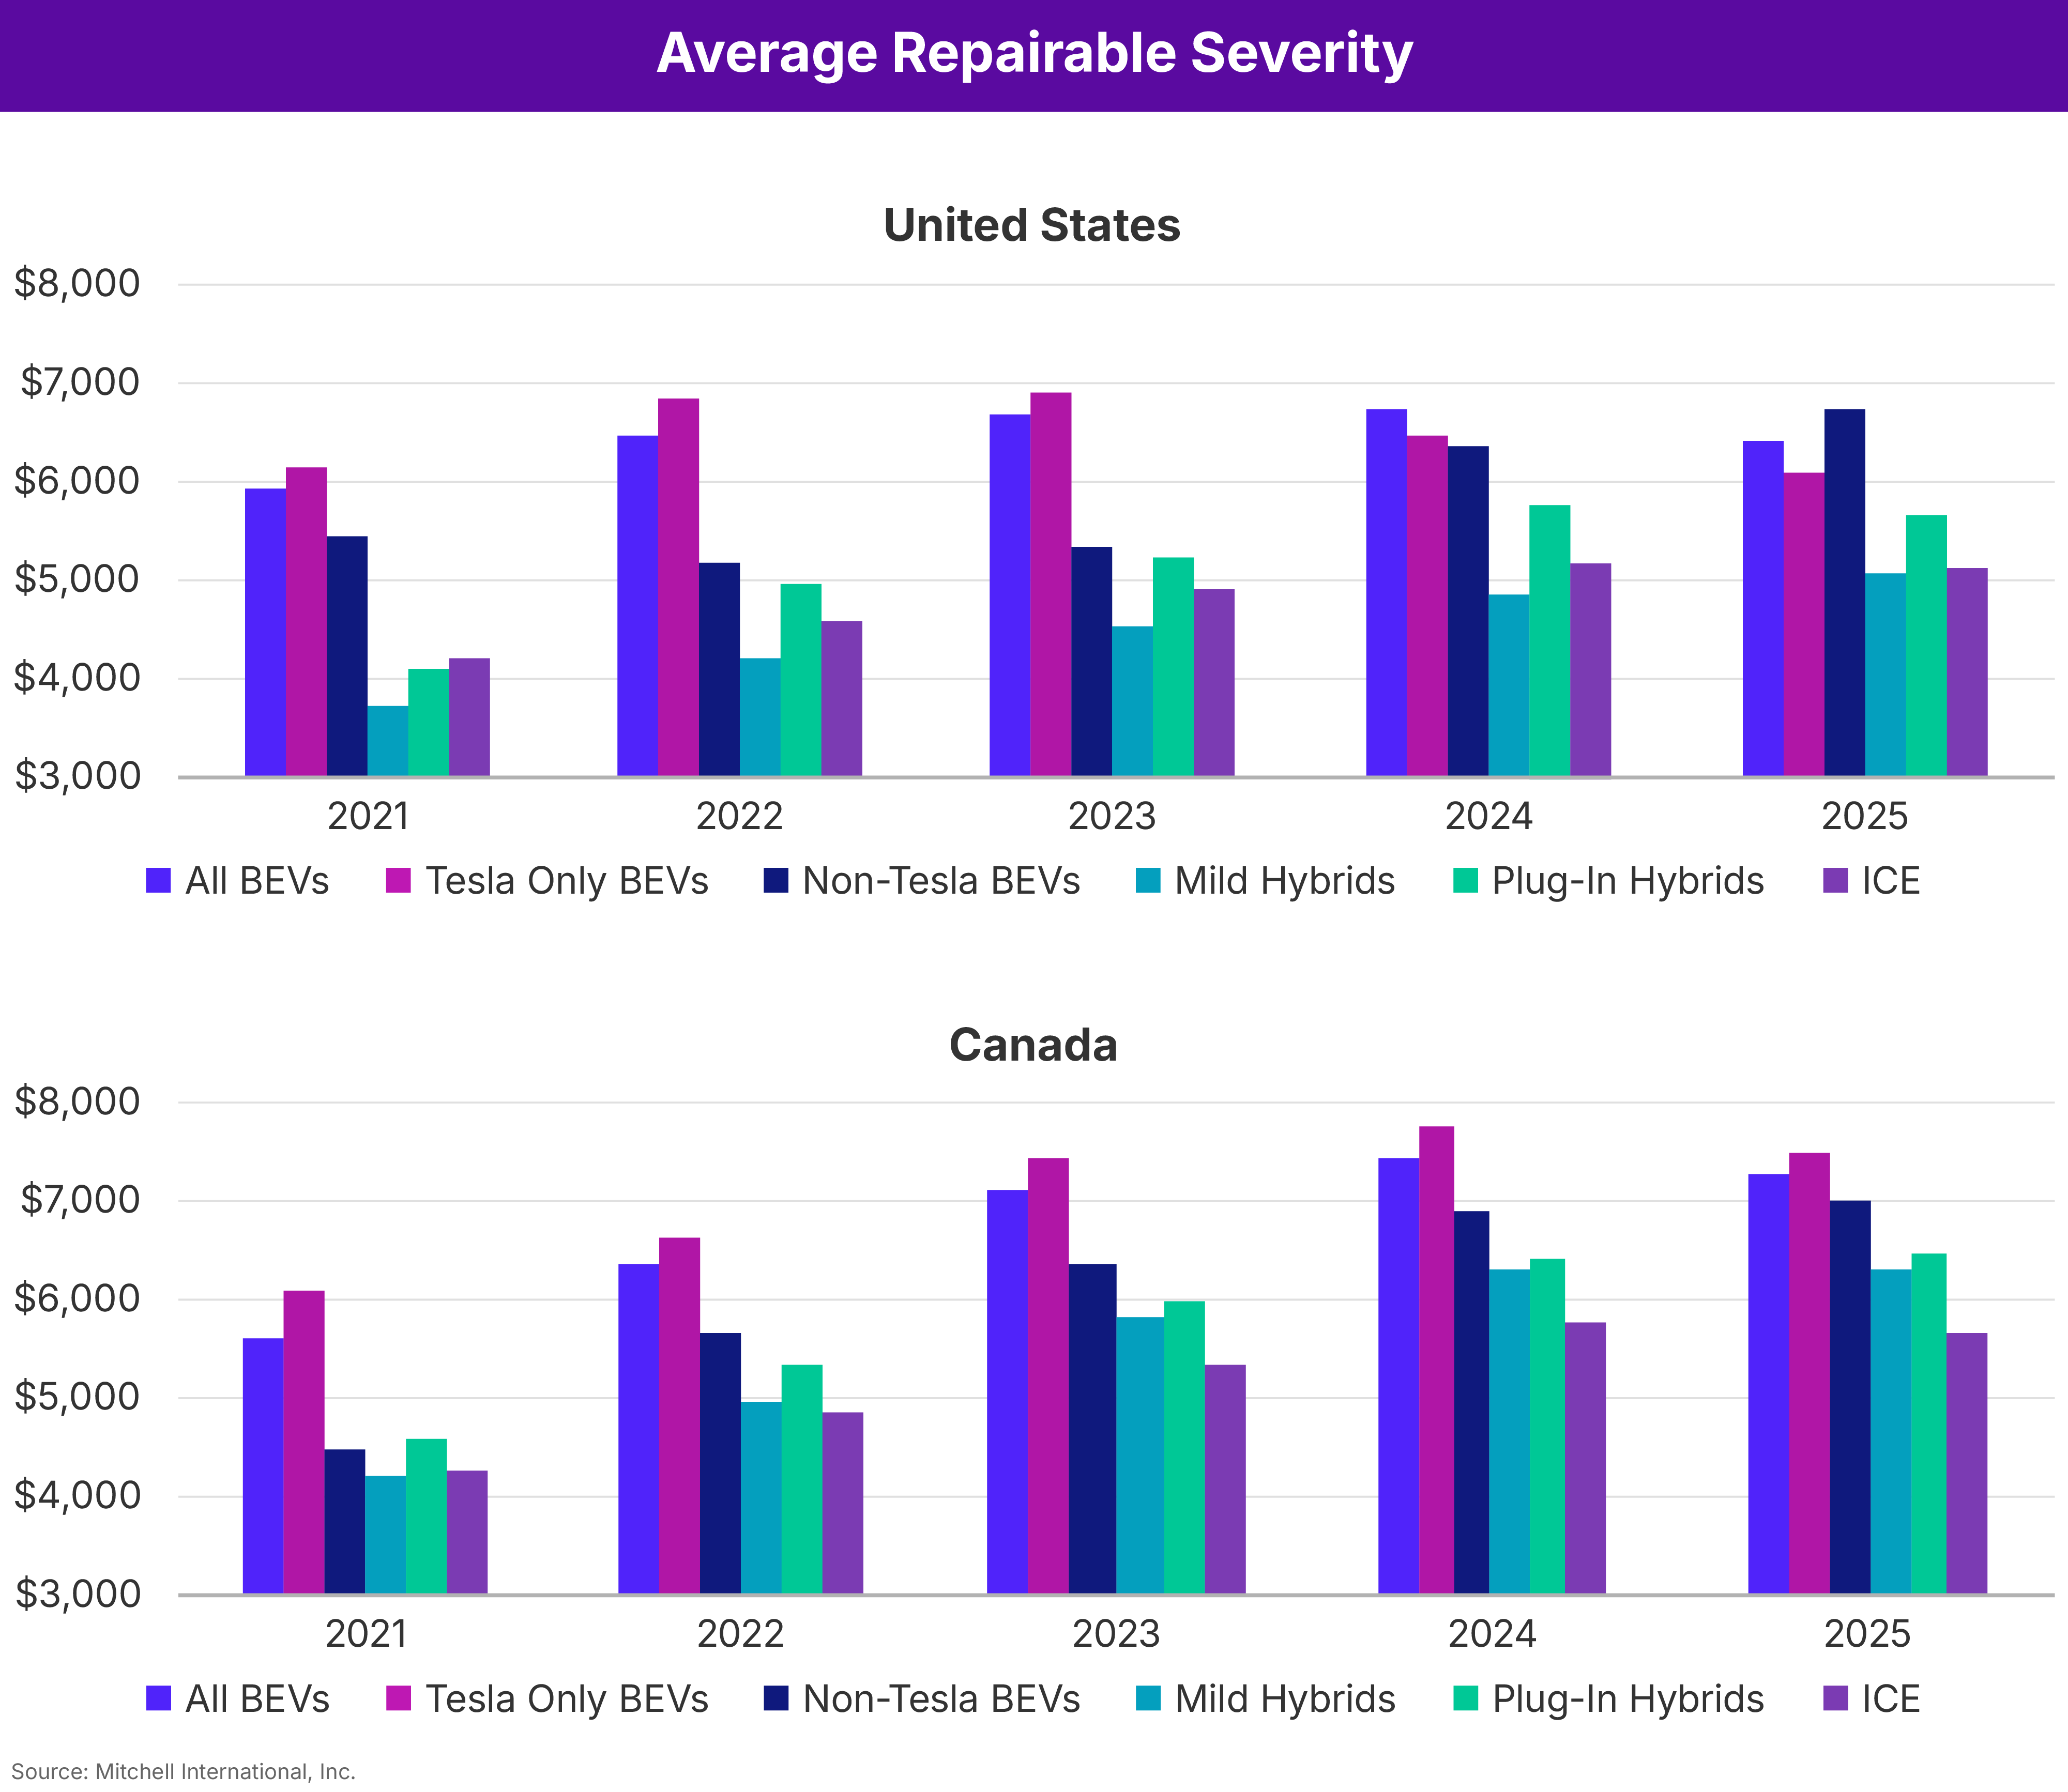
Although claim costs for BEVs have continued to grow steadily, they decreased 5% in the U.S. in 2025—dropping from $6,707 in 2024 to $6,395 last year. Claims severity also decreased slightly for ICE vehicles ($5,176 in 2024 vs. $5,105 in 2025) and PHEVs ($5,759 in 2024 vs. $5,628 in 2025) while jumping 4% for MHEVs ($4,865 in 2024 vs. $5,054 in 2025). Similarly, Canadian claims severity for repairable BEVs dropped 2% year over year, from $7,410 in 2024 to $7,253 in 2025. Severity for ICE automobiles ($5,726 in 2024 vs. $5,659 in 2025), MHEVs ($6,268 in 2024 vs. $6,267 in 2025) and PHEVs ($6,411 in 2024 vs. $6,442 in 2025) remained relatively flat.
With dense electrical architectures, software-driven systems and sensor-heavy designs, BEVs generate high diagnostic and calibration demands—keeping repair complexity firmly in place regardless of market fluctuations. Last year, BEVs averaged 1.70 calibrations per estimate, compared with 1.54 for ICE vehicles and 1.63 for hybrids (both MHEVs and PHEVs combined). As calibrations become increasingly common across all vehicle types, markets with higher concentrations of battery electric and hybrid vehicles continue to experience greater repair demands—requiring collision facilities to maintain, or expand, existing capabilities and auto insurers to account for these additional repair operations and costs when underwriting.
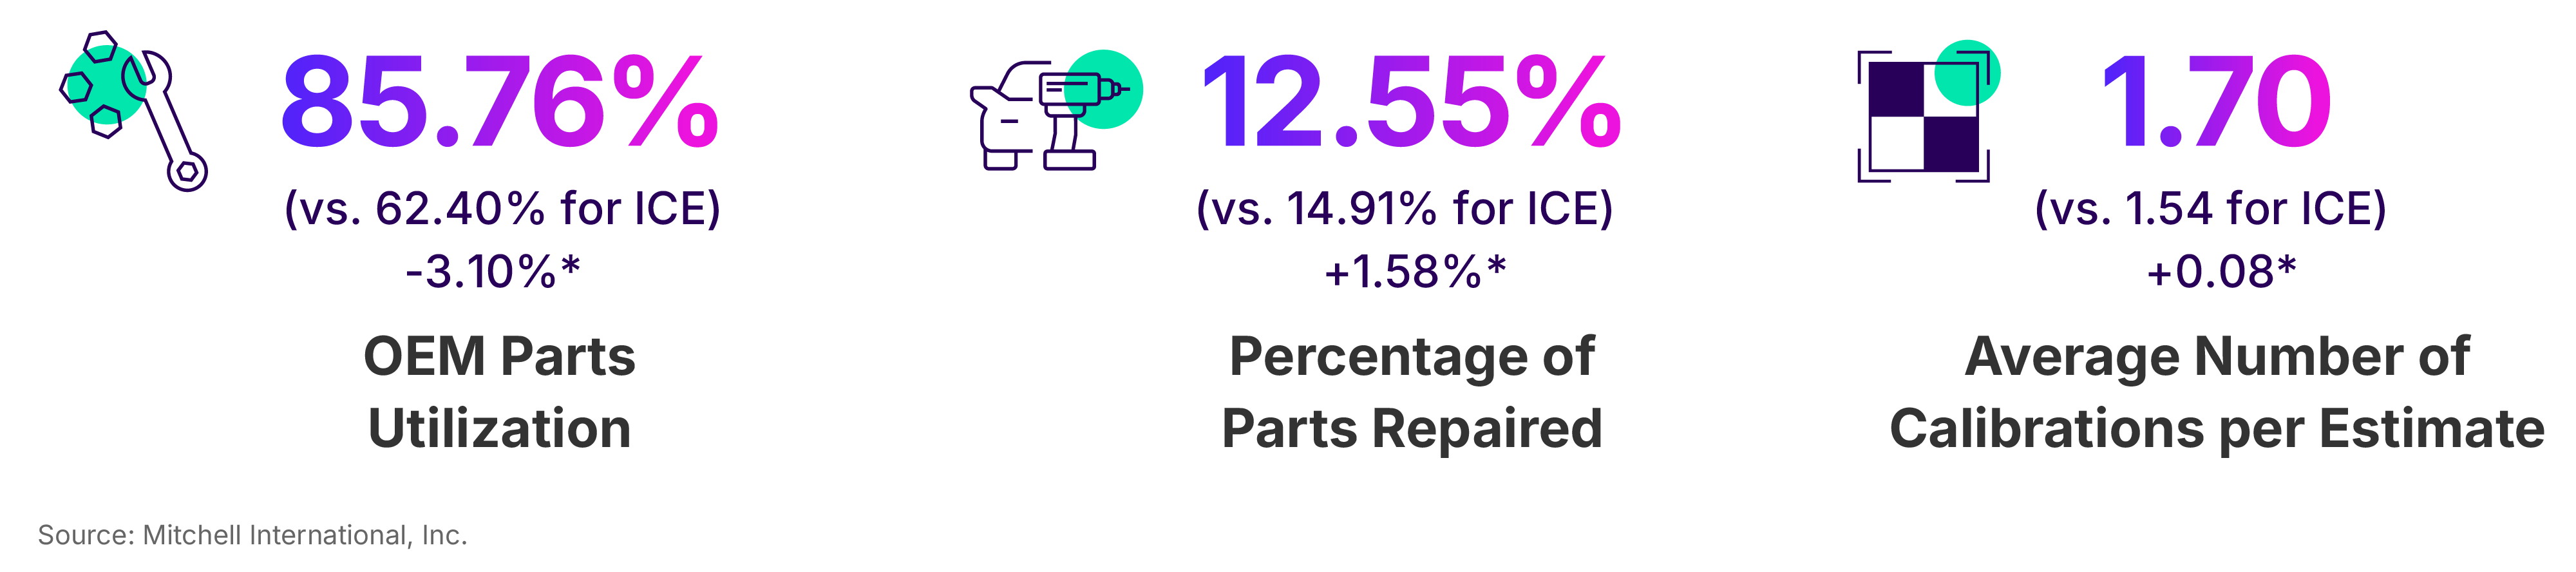
By the Numbers
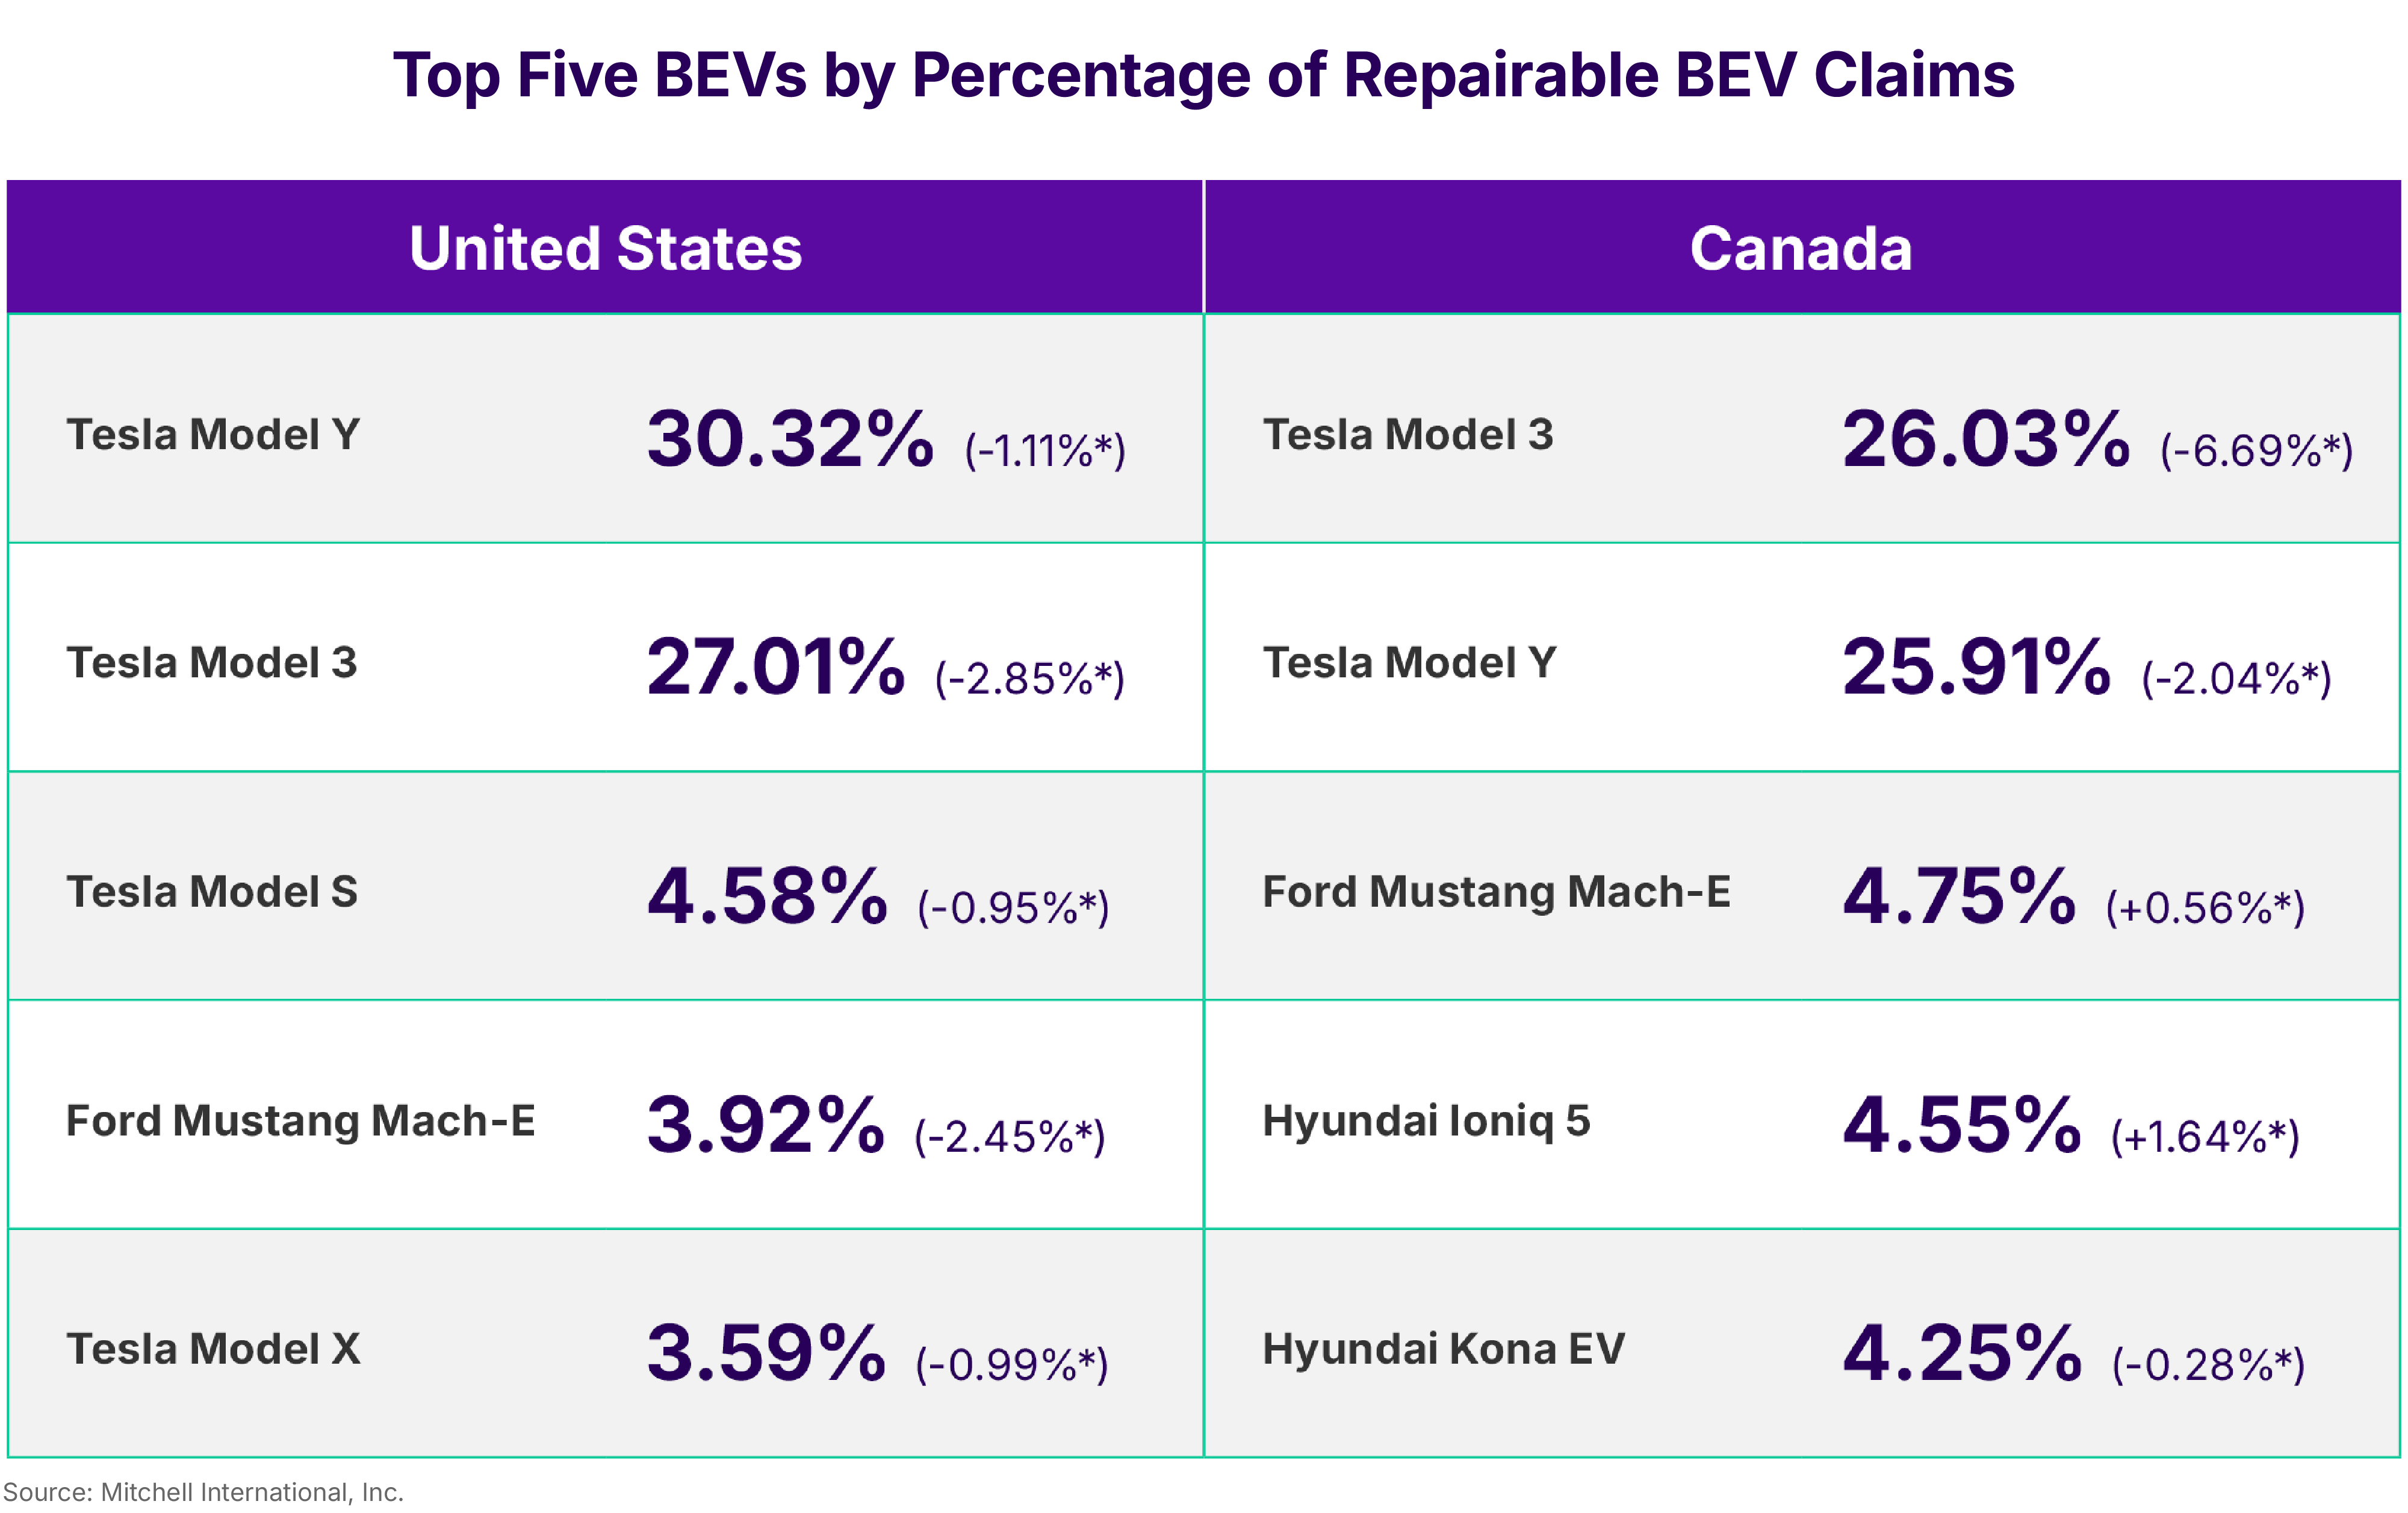
*Difference between 2025 and 2024.
Subscribe Now
To subscribe to future issues of Mitchell's Plugged-In: EV Collision Insights report, please complete the form below.