

Average Length of Rental for Repairable Vehicles: Q4 2023
The quarterly LOR summary is produced by Enterprise Rent-A-Car. Through its ARMS® Automotive Suite of Products, Enterprise provides collision repair facilities with free cycle time reporting with market comparisons, free text/email capability to update their customers on vehicle repair status, and online reservations. More information is available at armsautosuite.com.
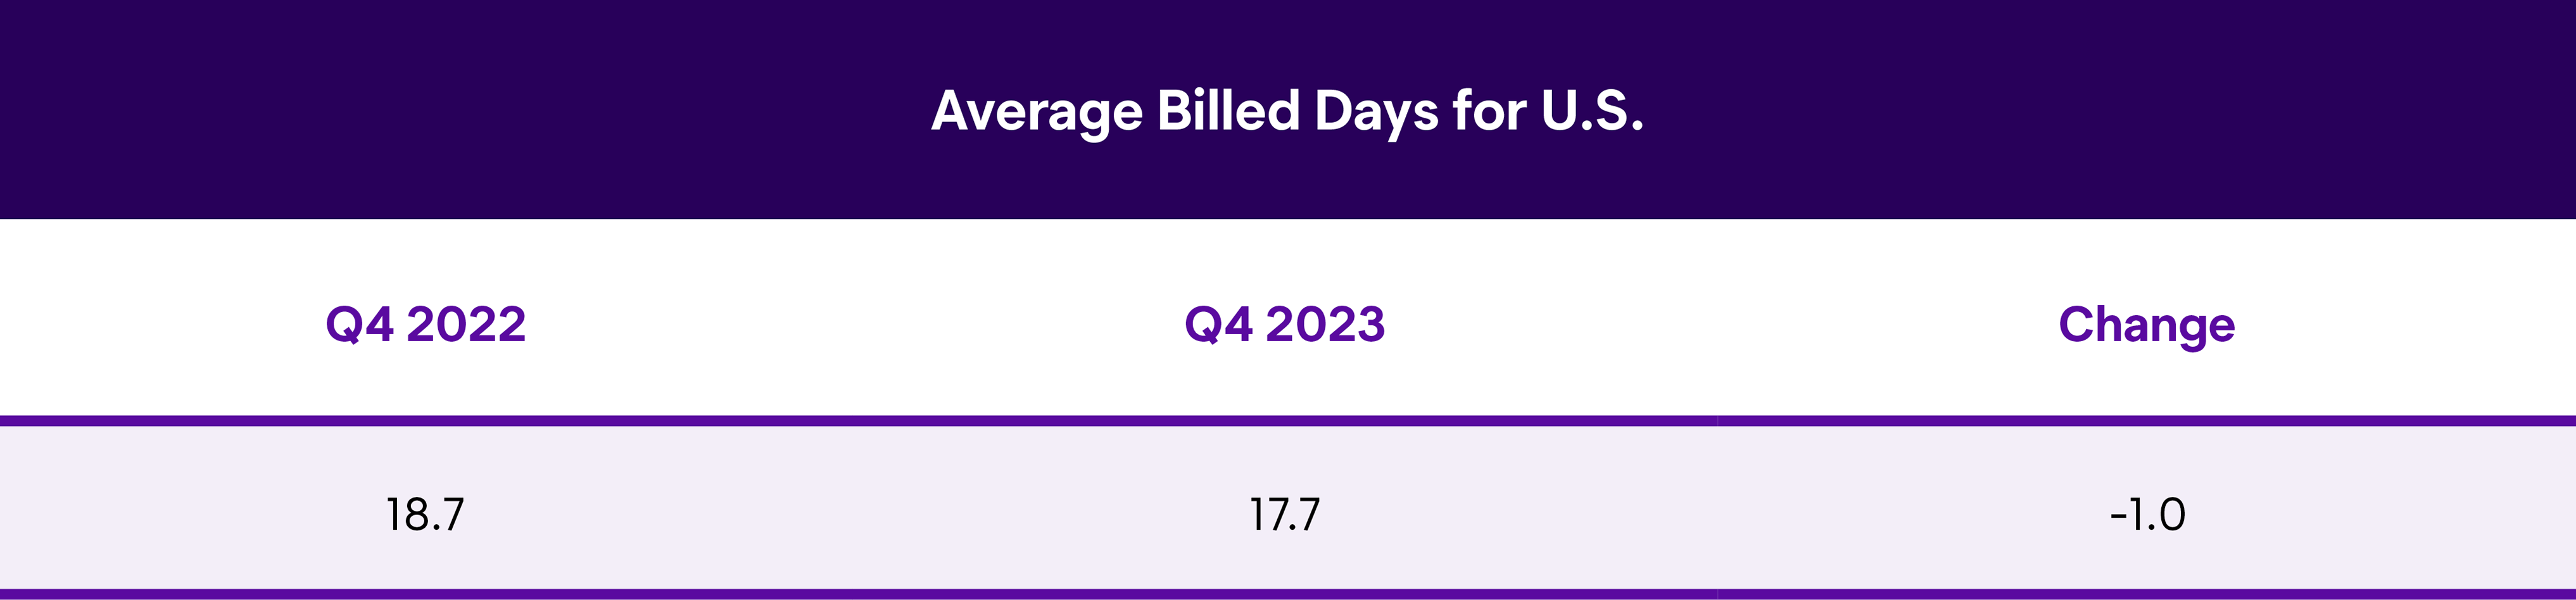
U.S. Length of Rental—Q4 2023
Overall length of rental (LOR) for collision-related rentals in Q4 2023 was 17.7 days, a one-day decline from Q4 2022. In Q4 2022, LOR (18.7 days) was up one-half day from Q4 2021, so the trend of declining year-over-year LOR we’ve been tracking since Q2 2023 continues. Compared to Q4 2021, LOR is up 0.7 days.
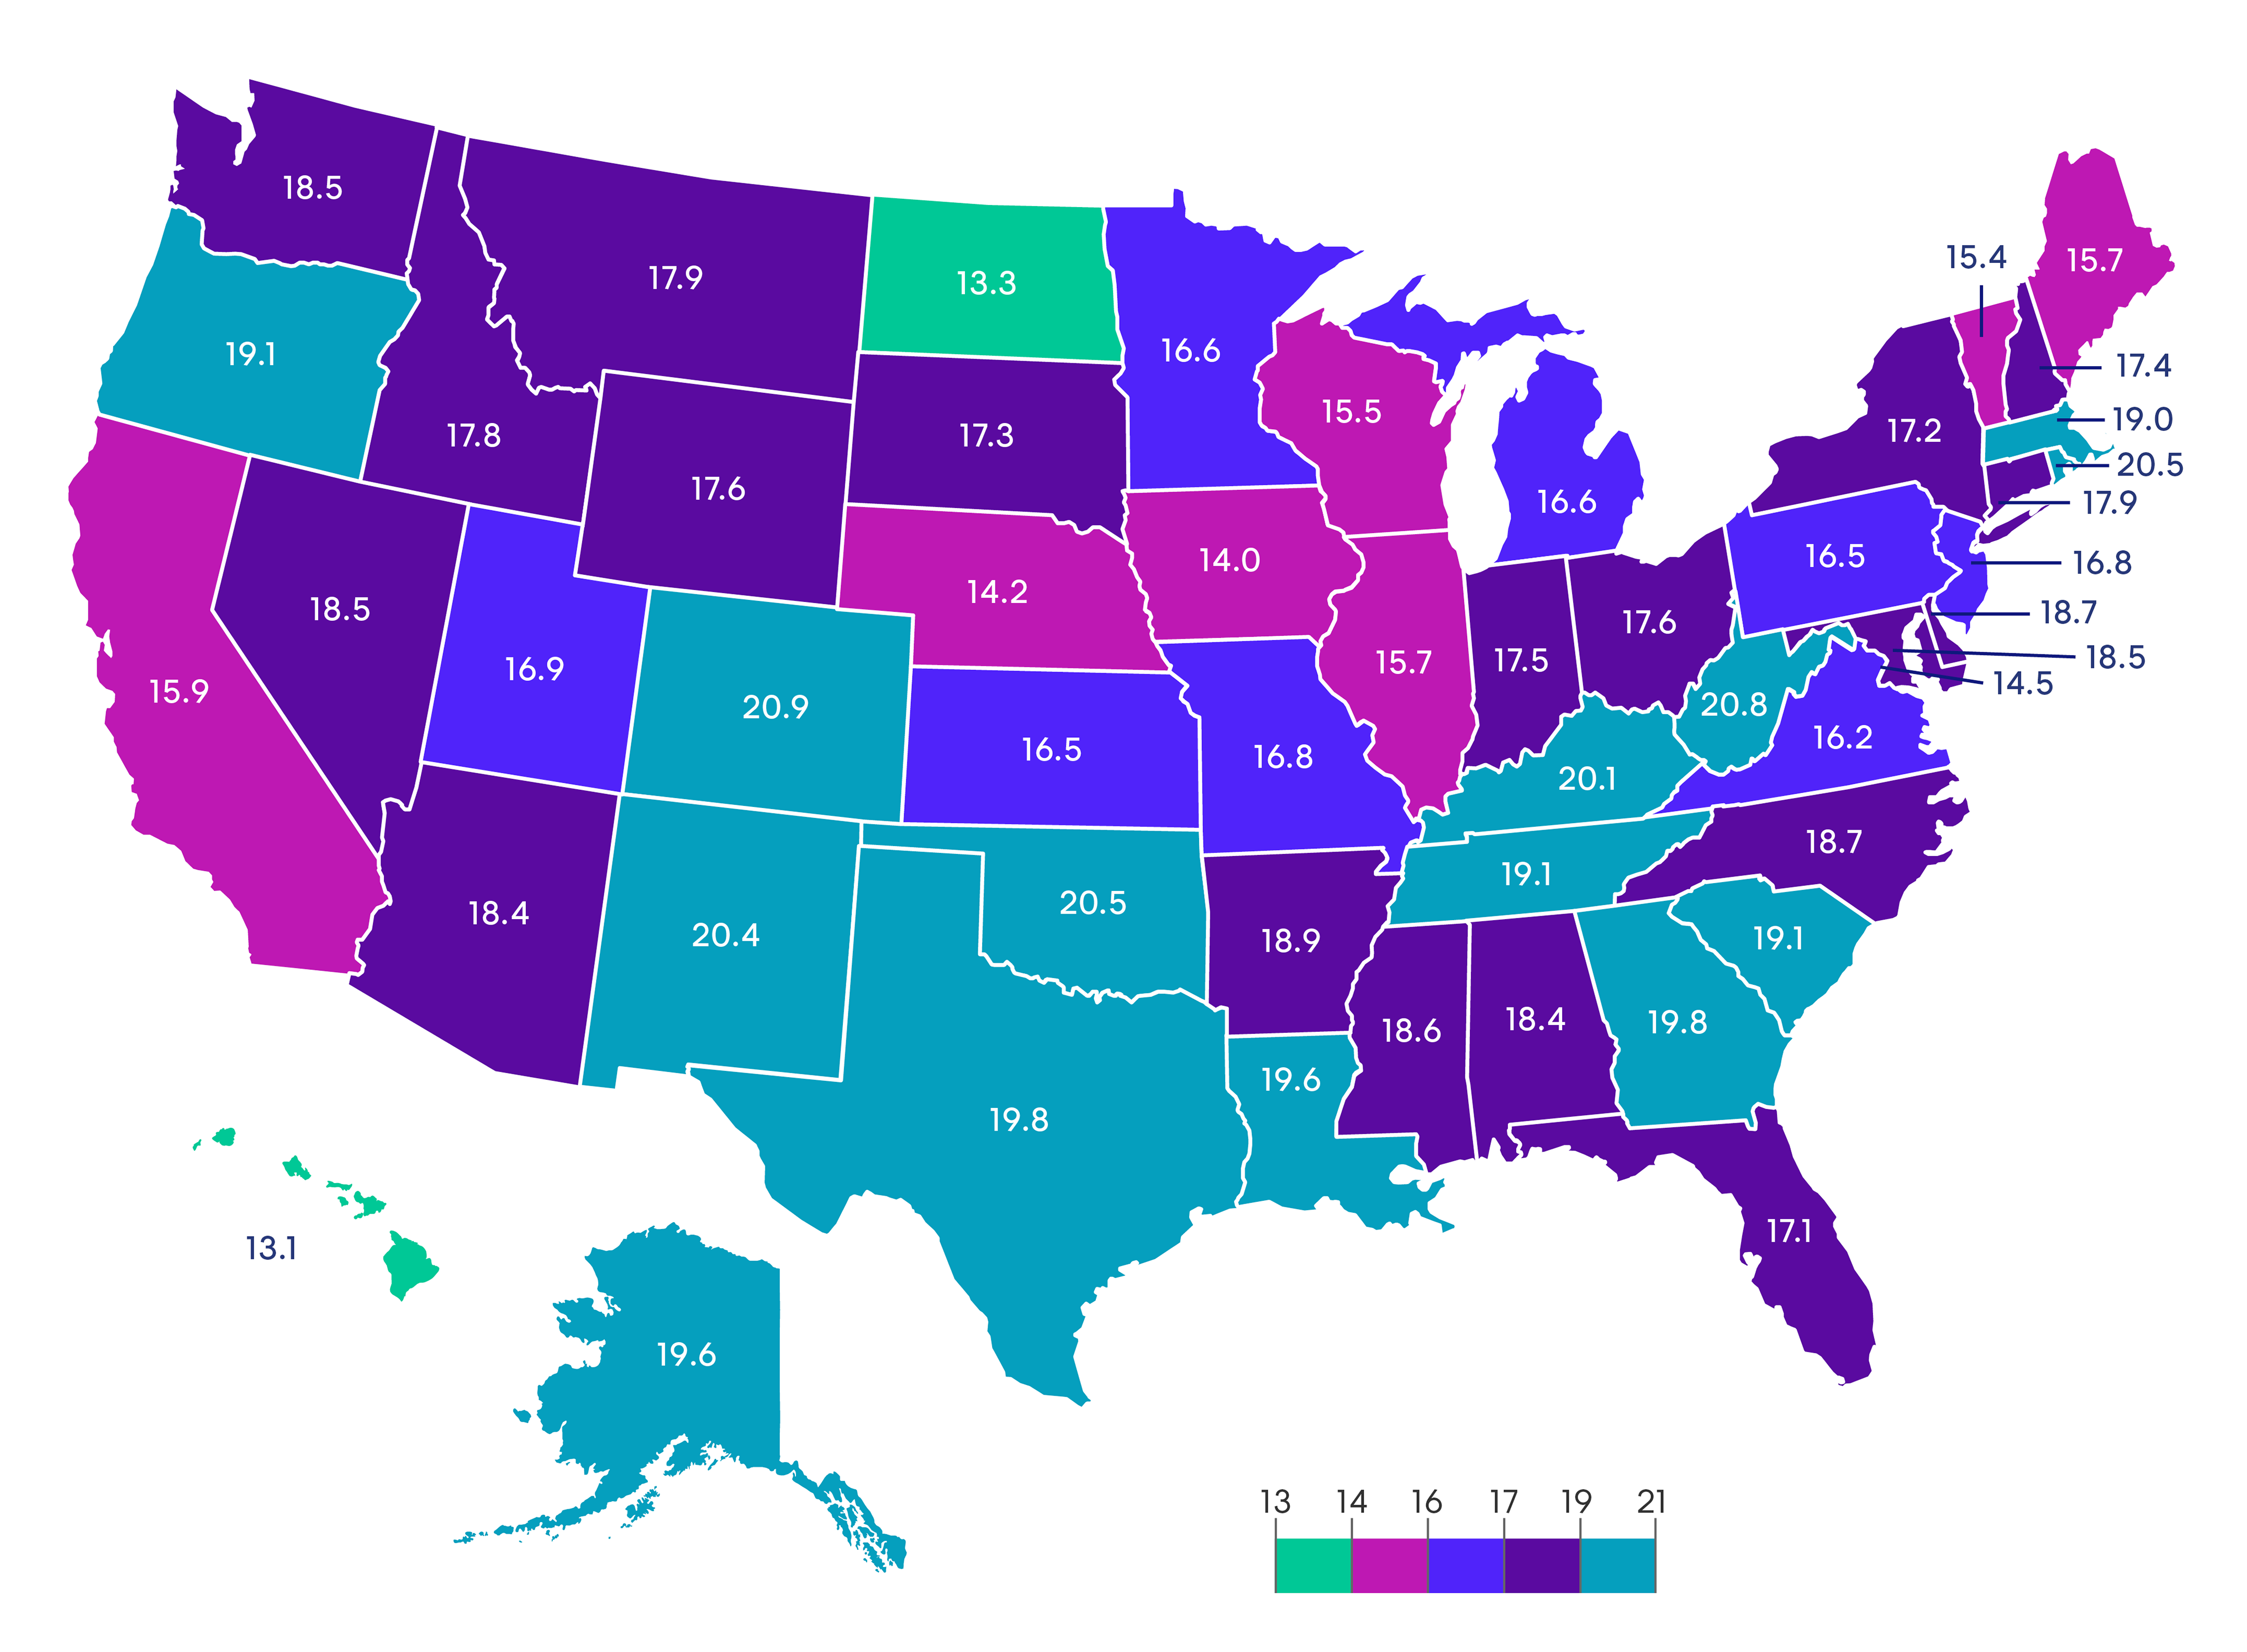
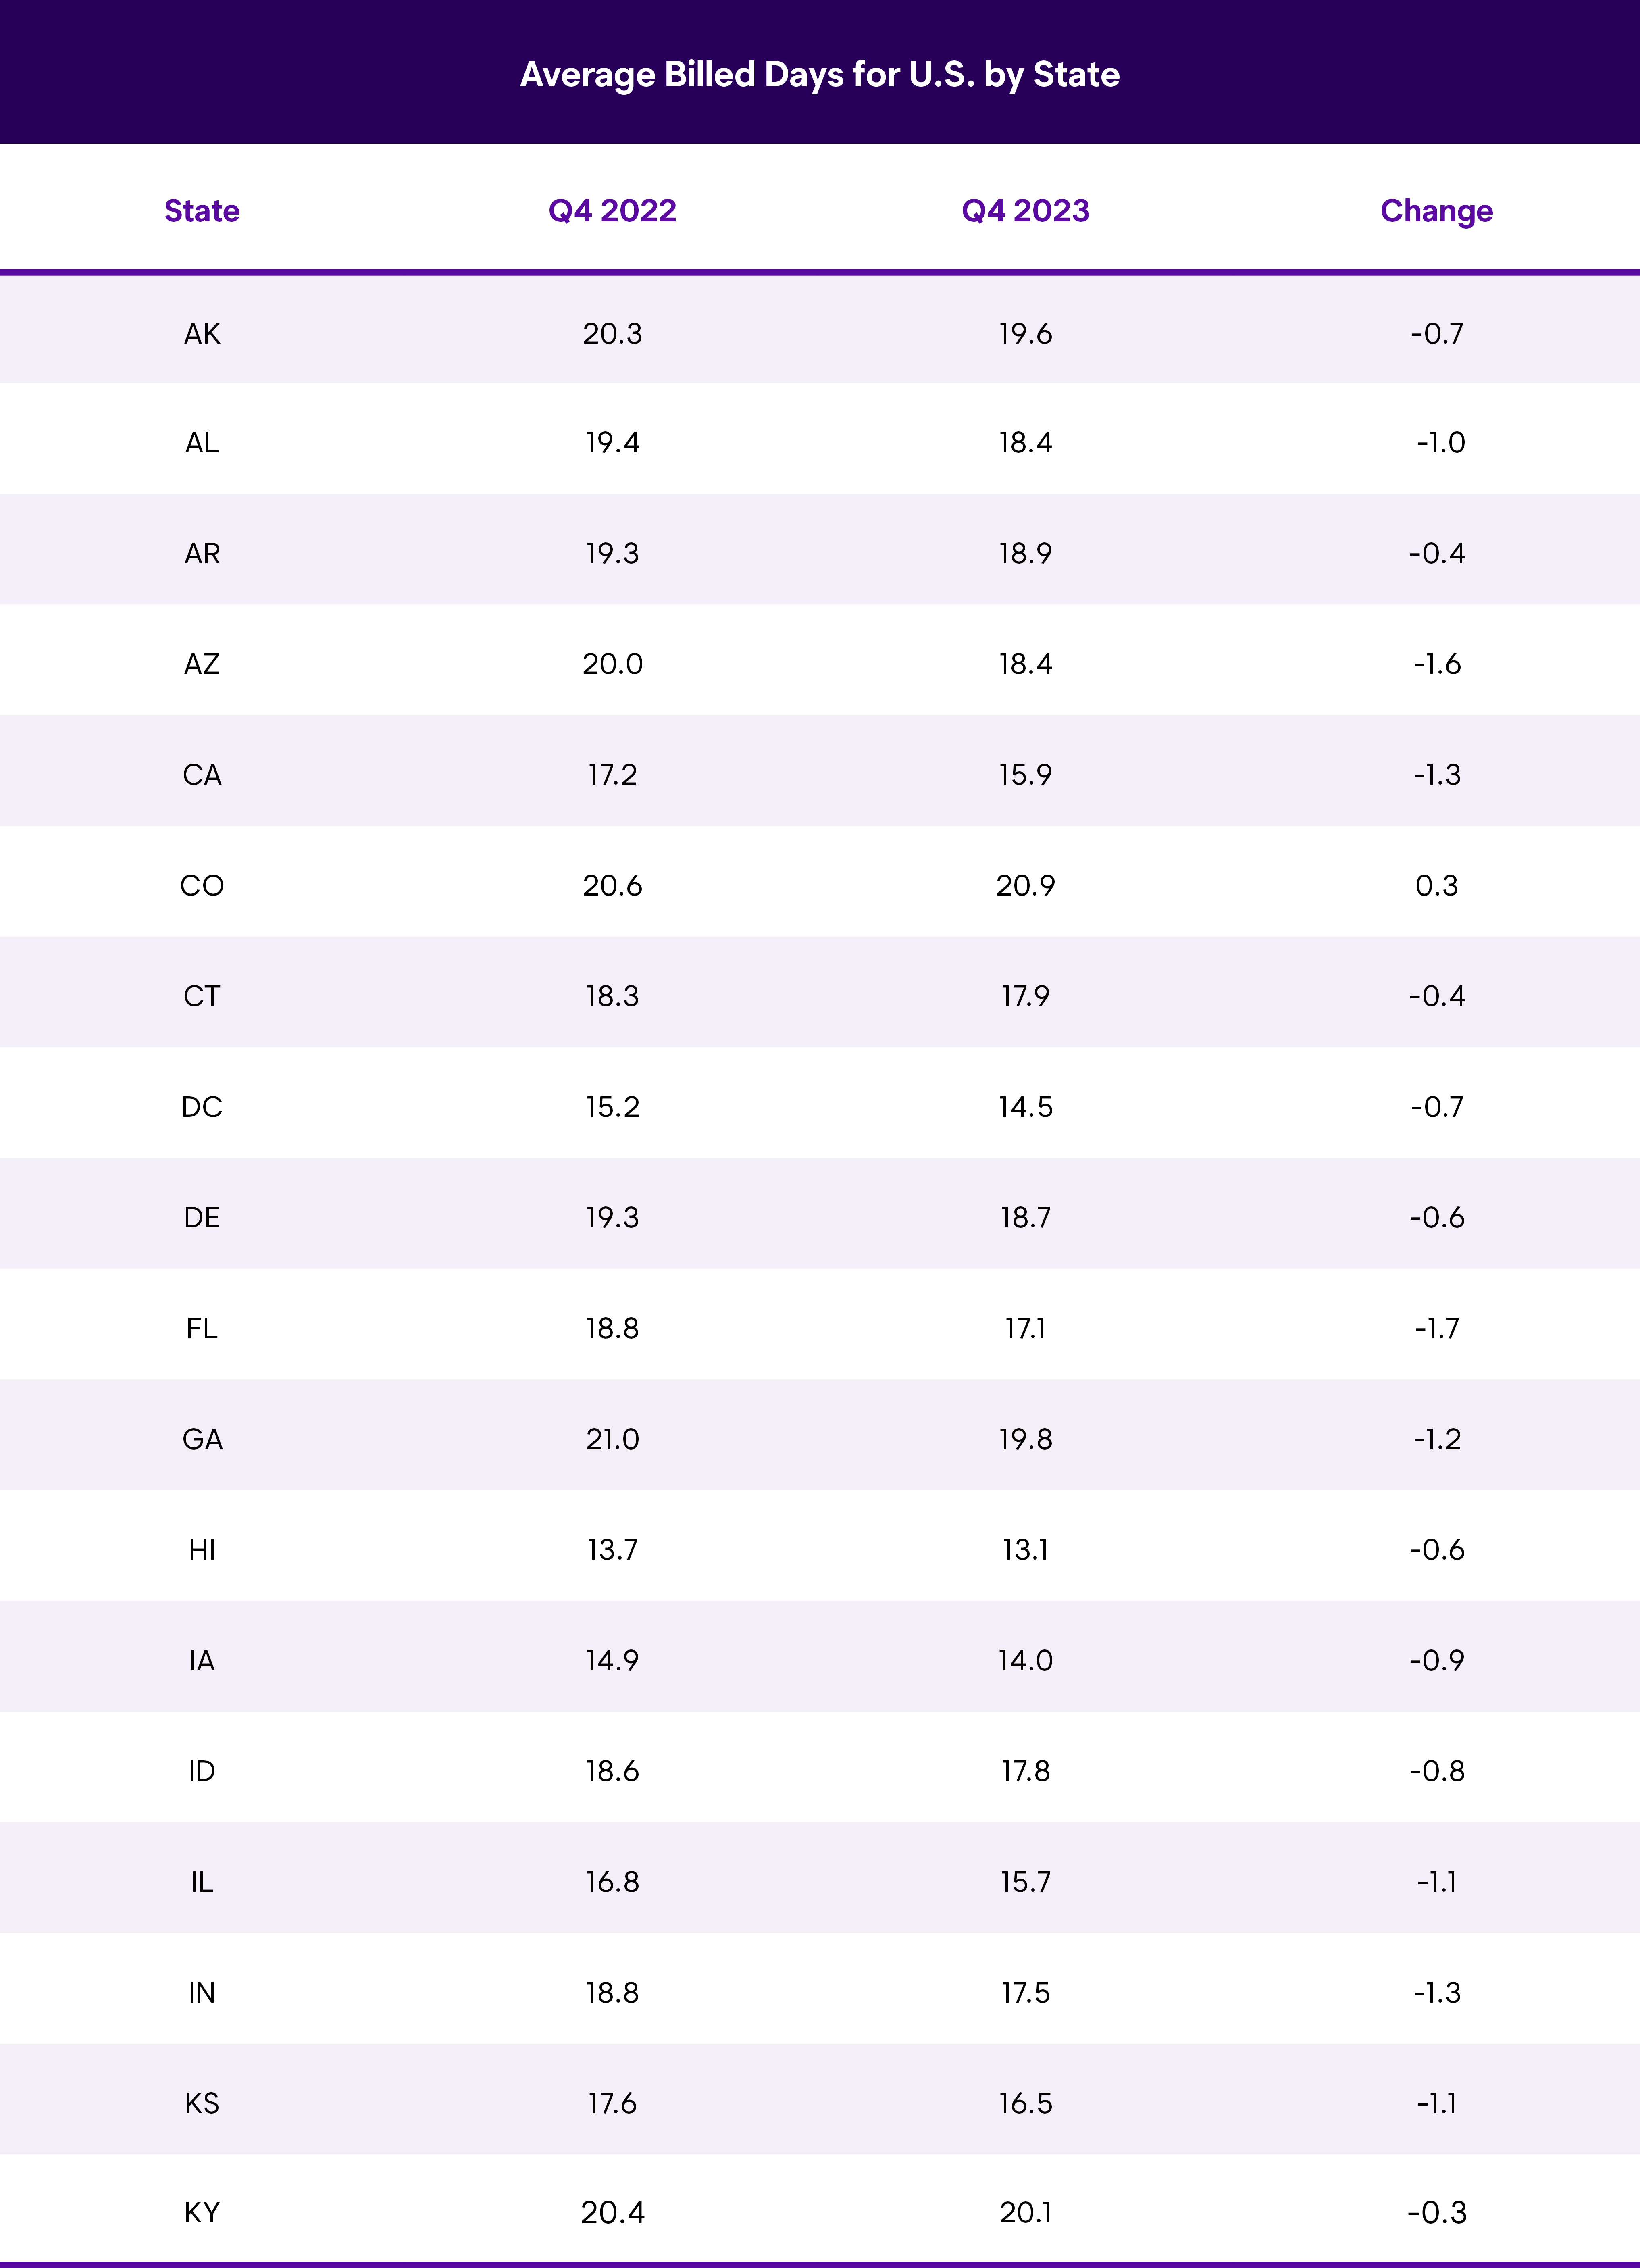
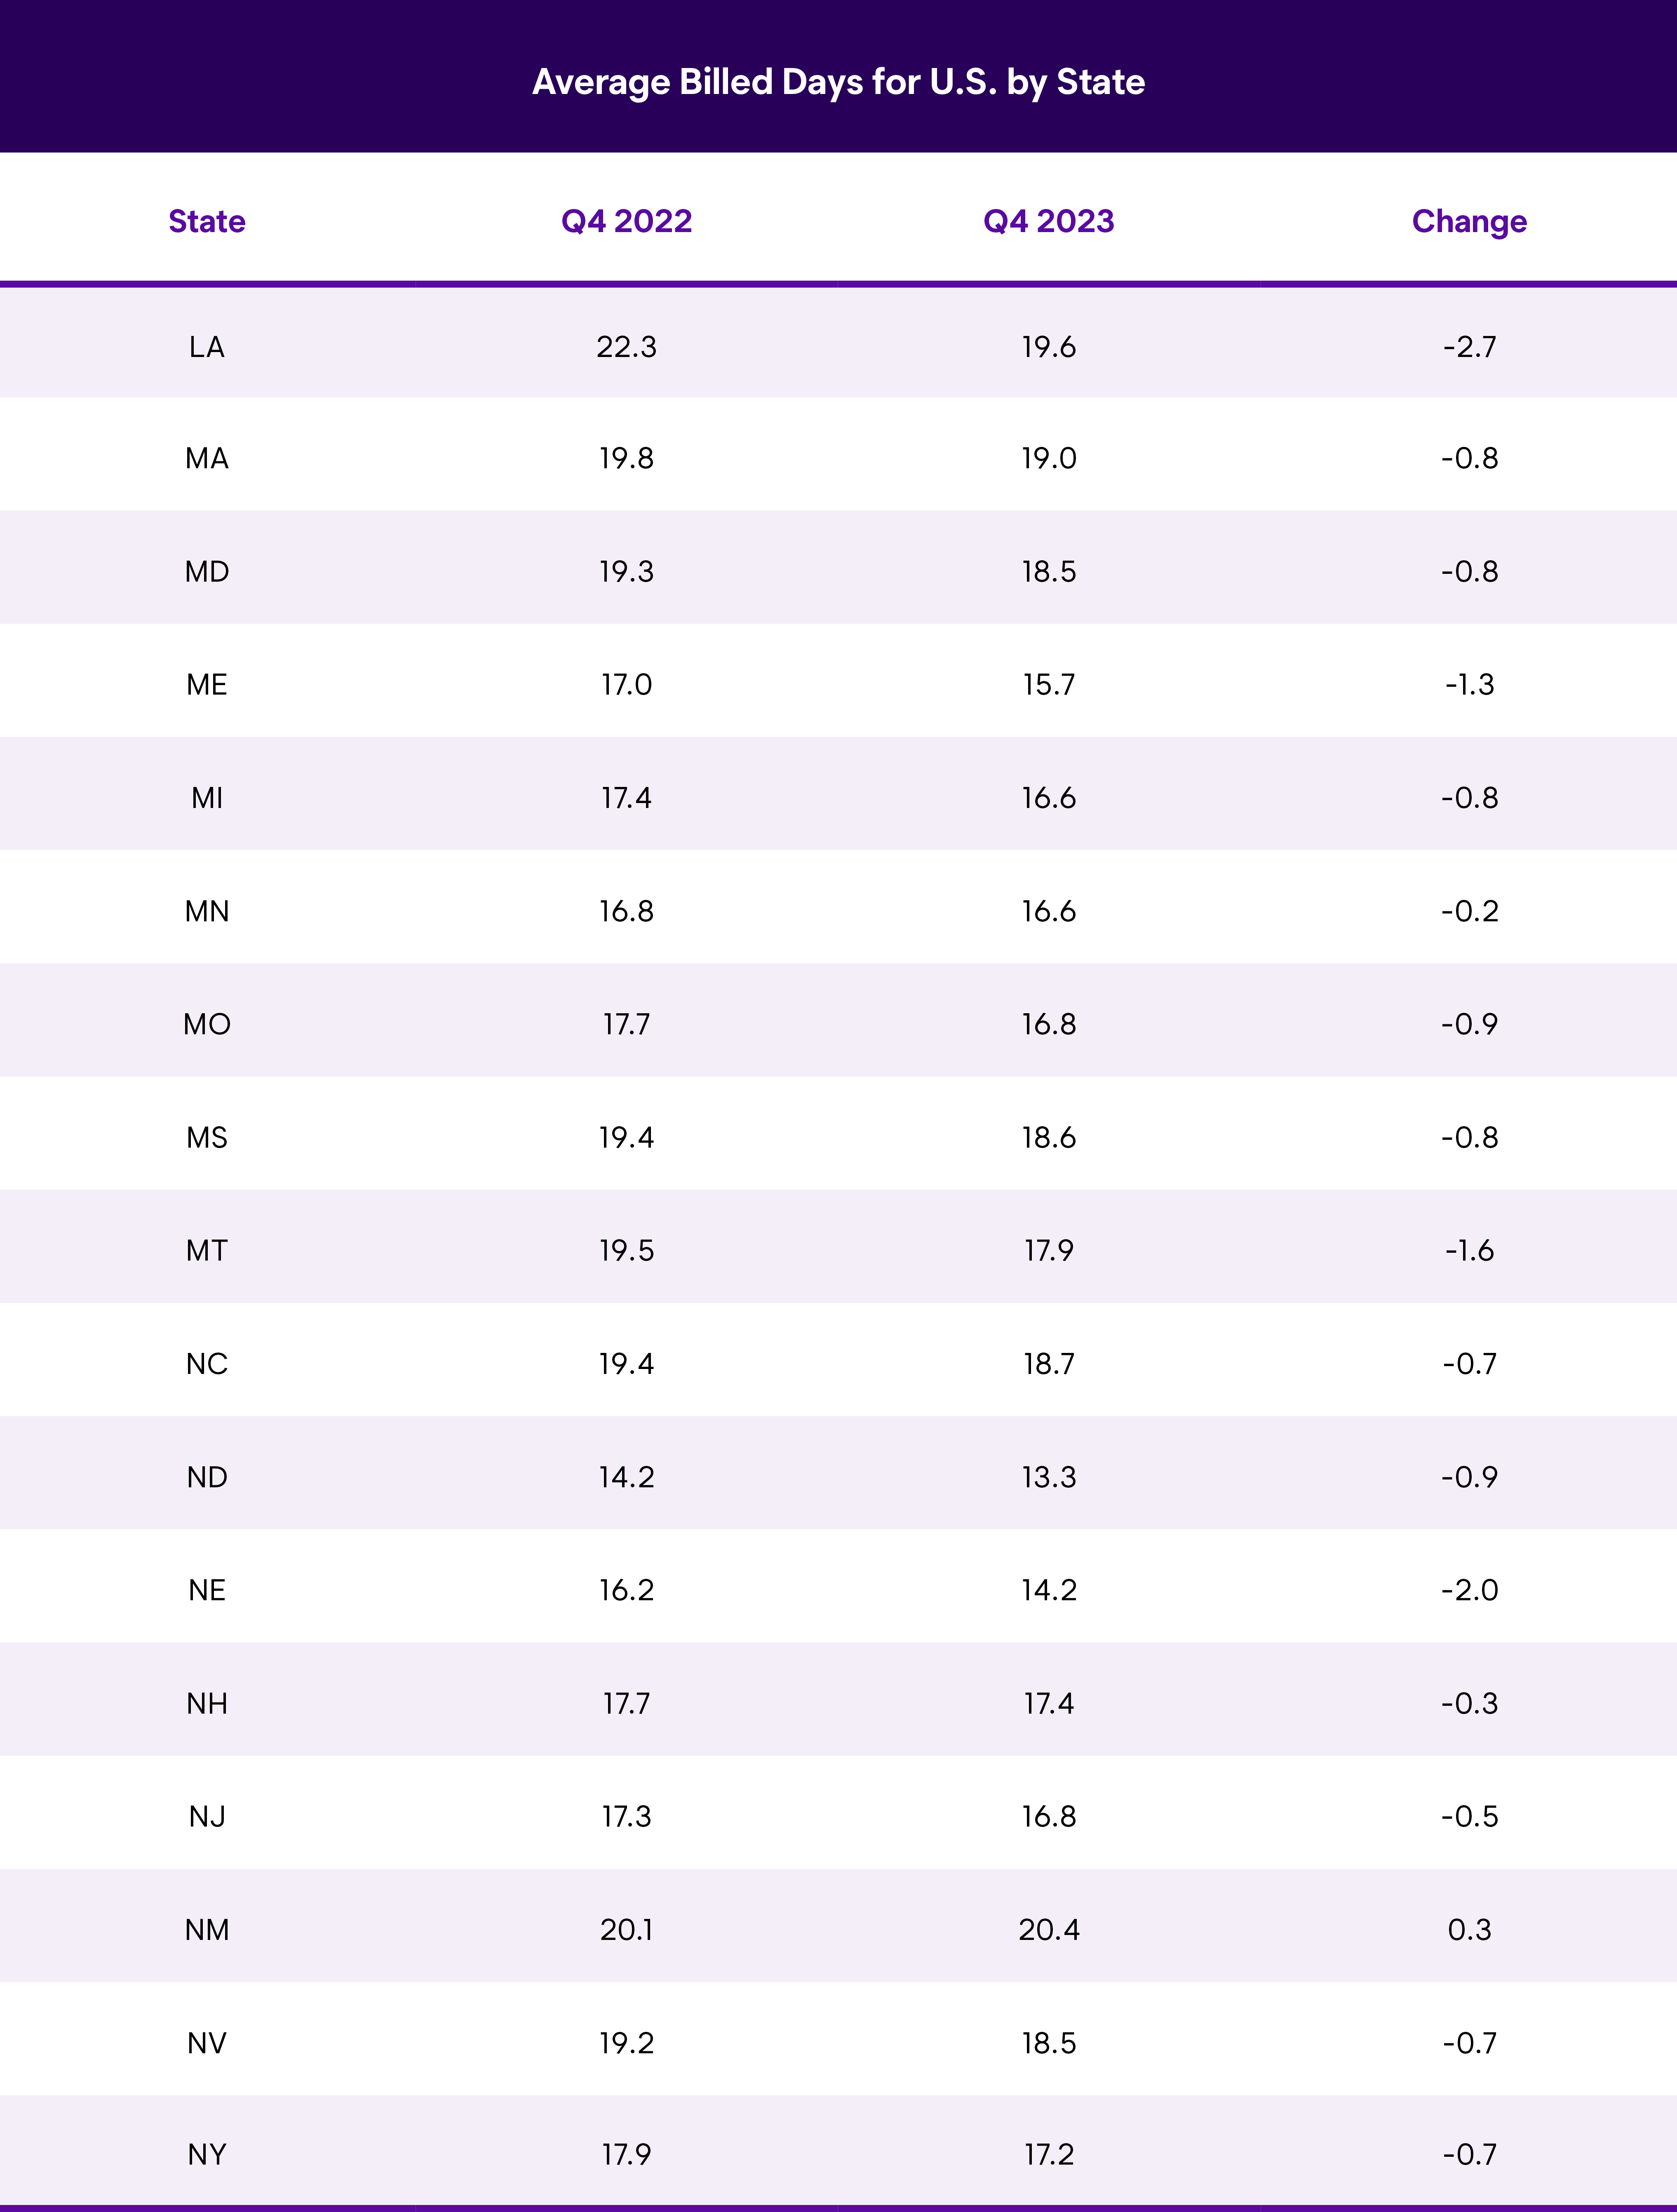
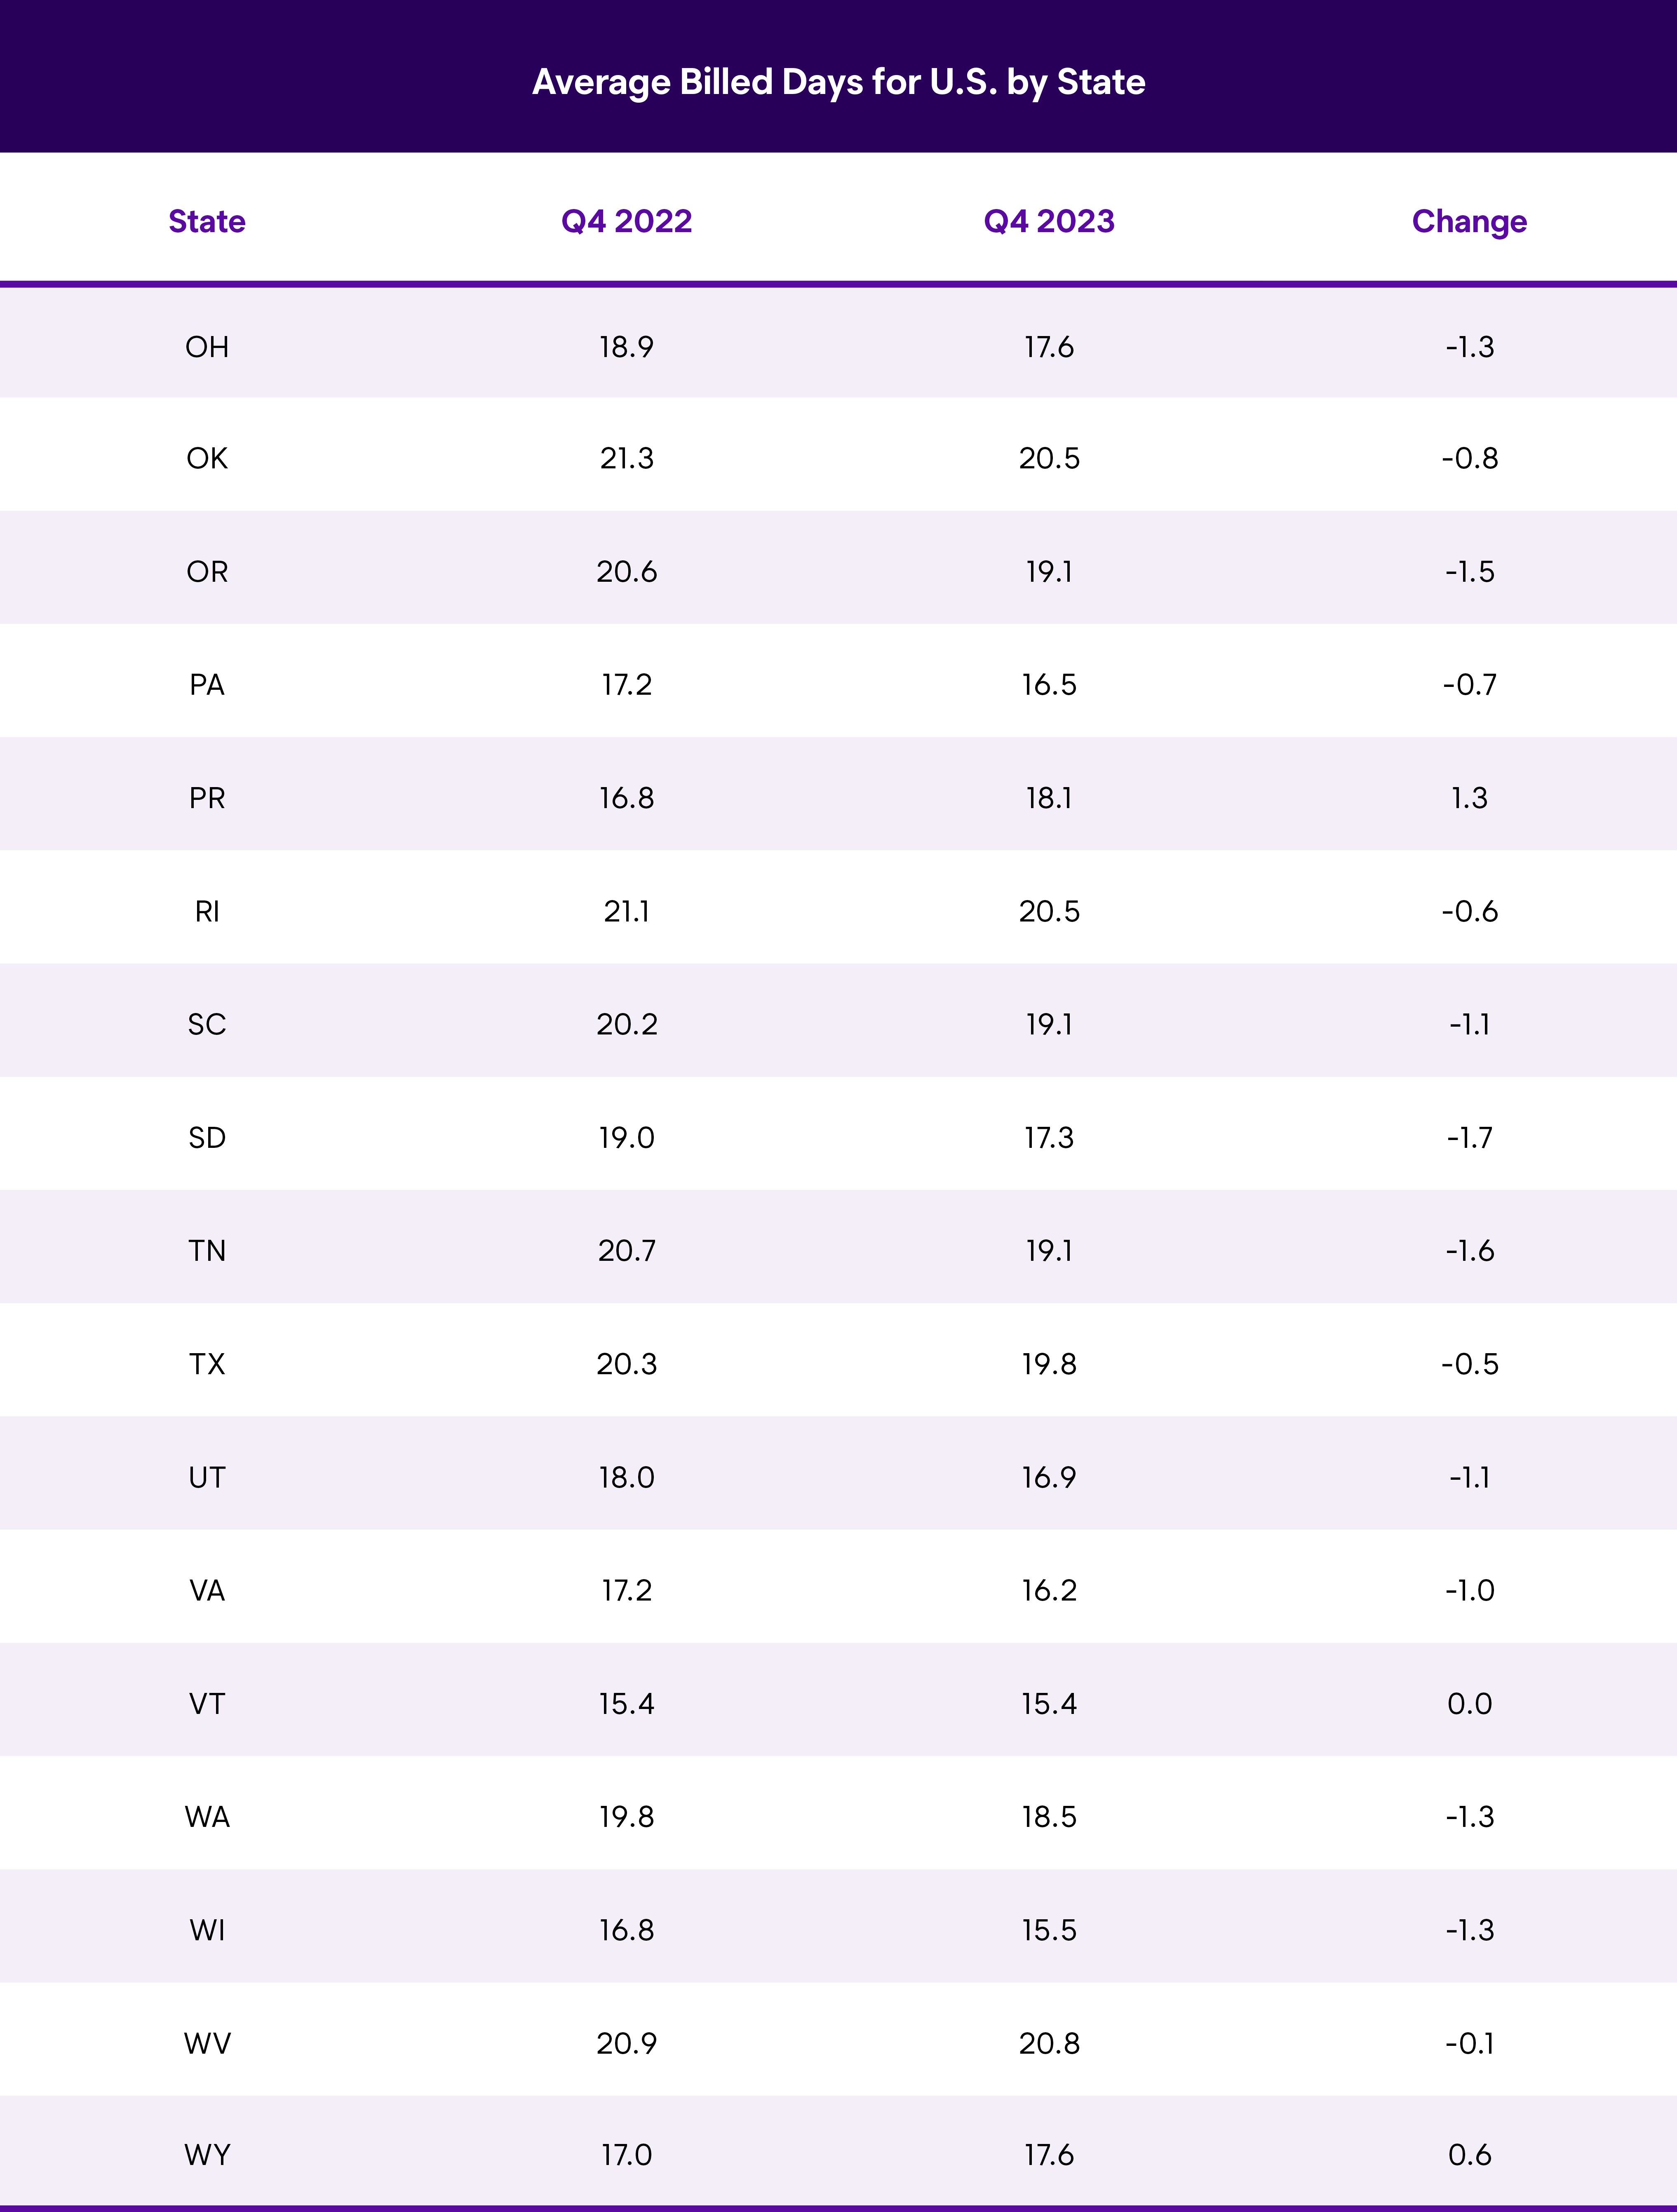
U.S. Average Length of Rental (LOR) by State—Q4 2023
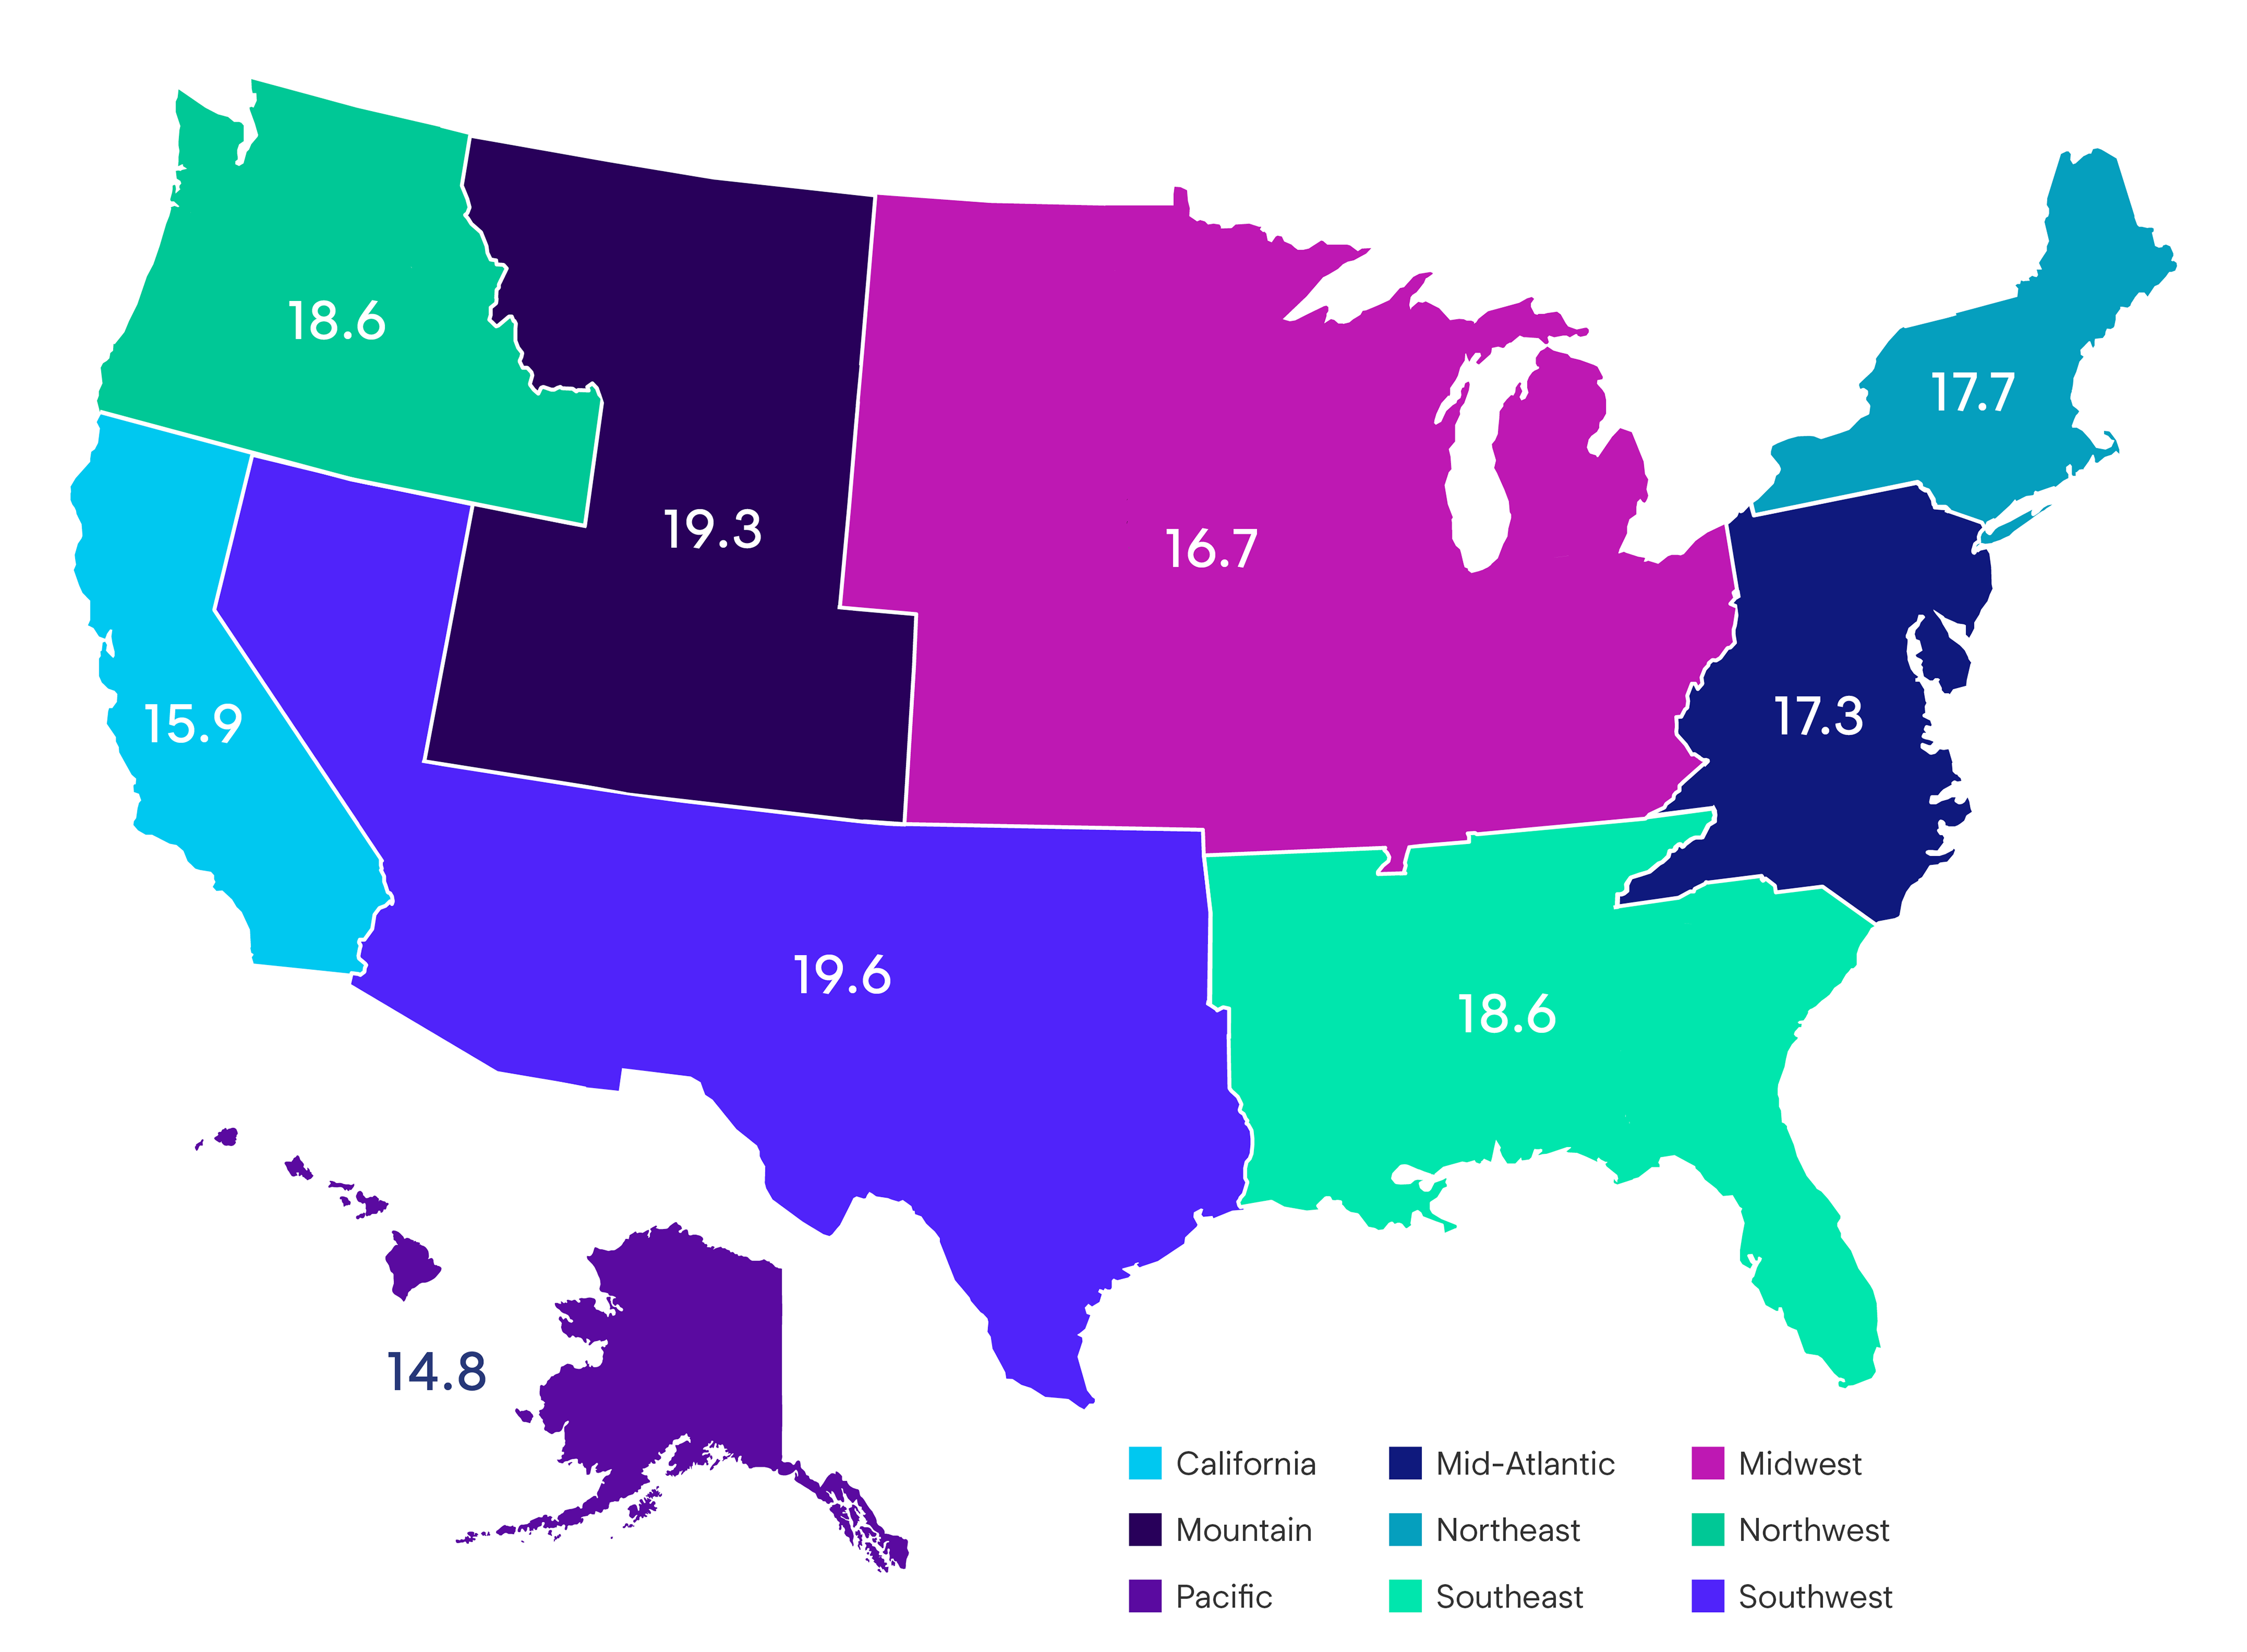
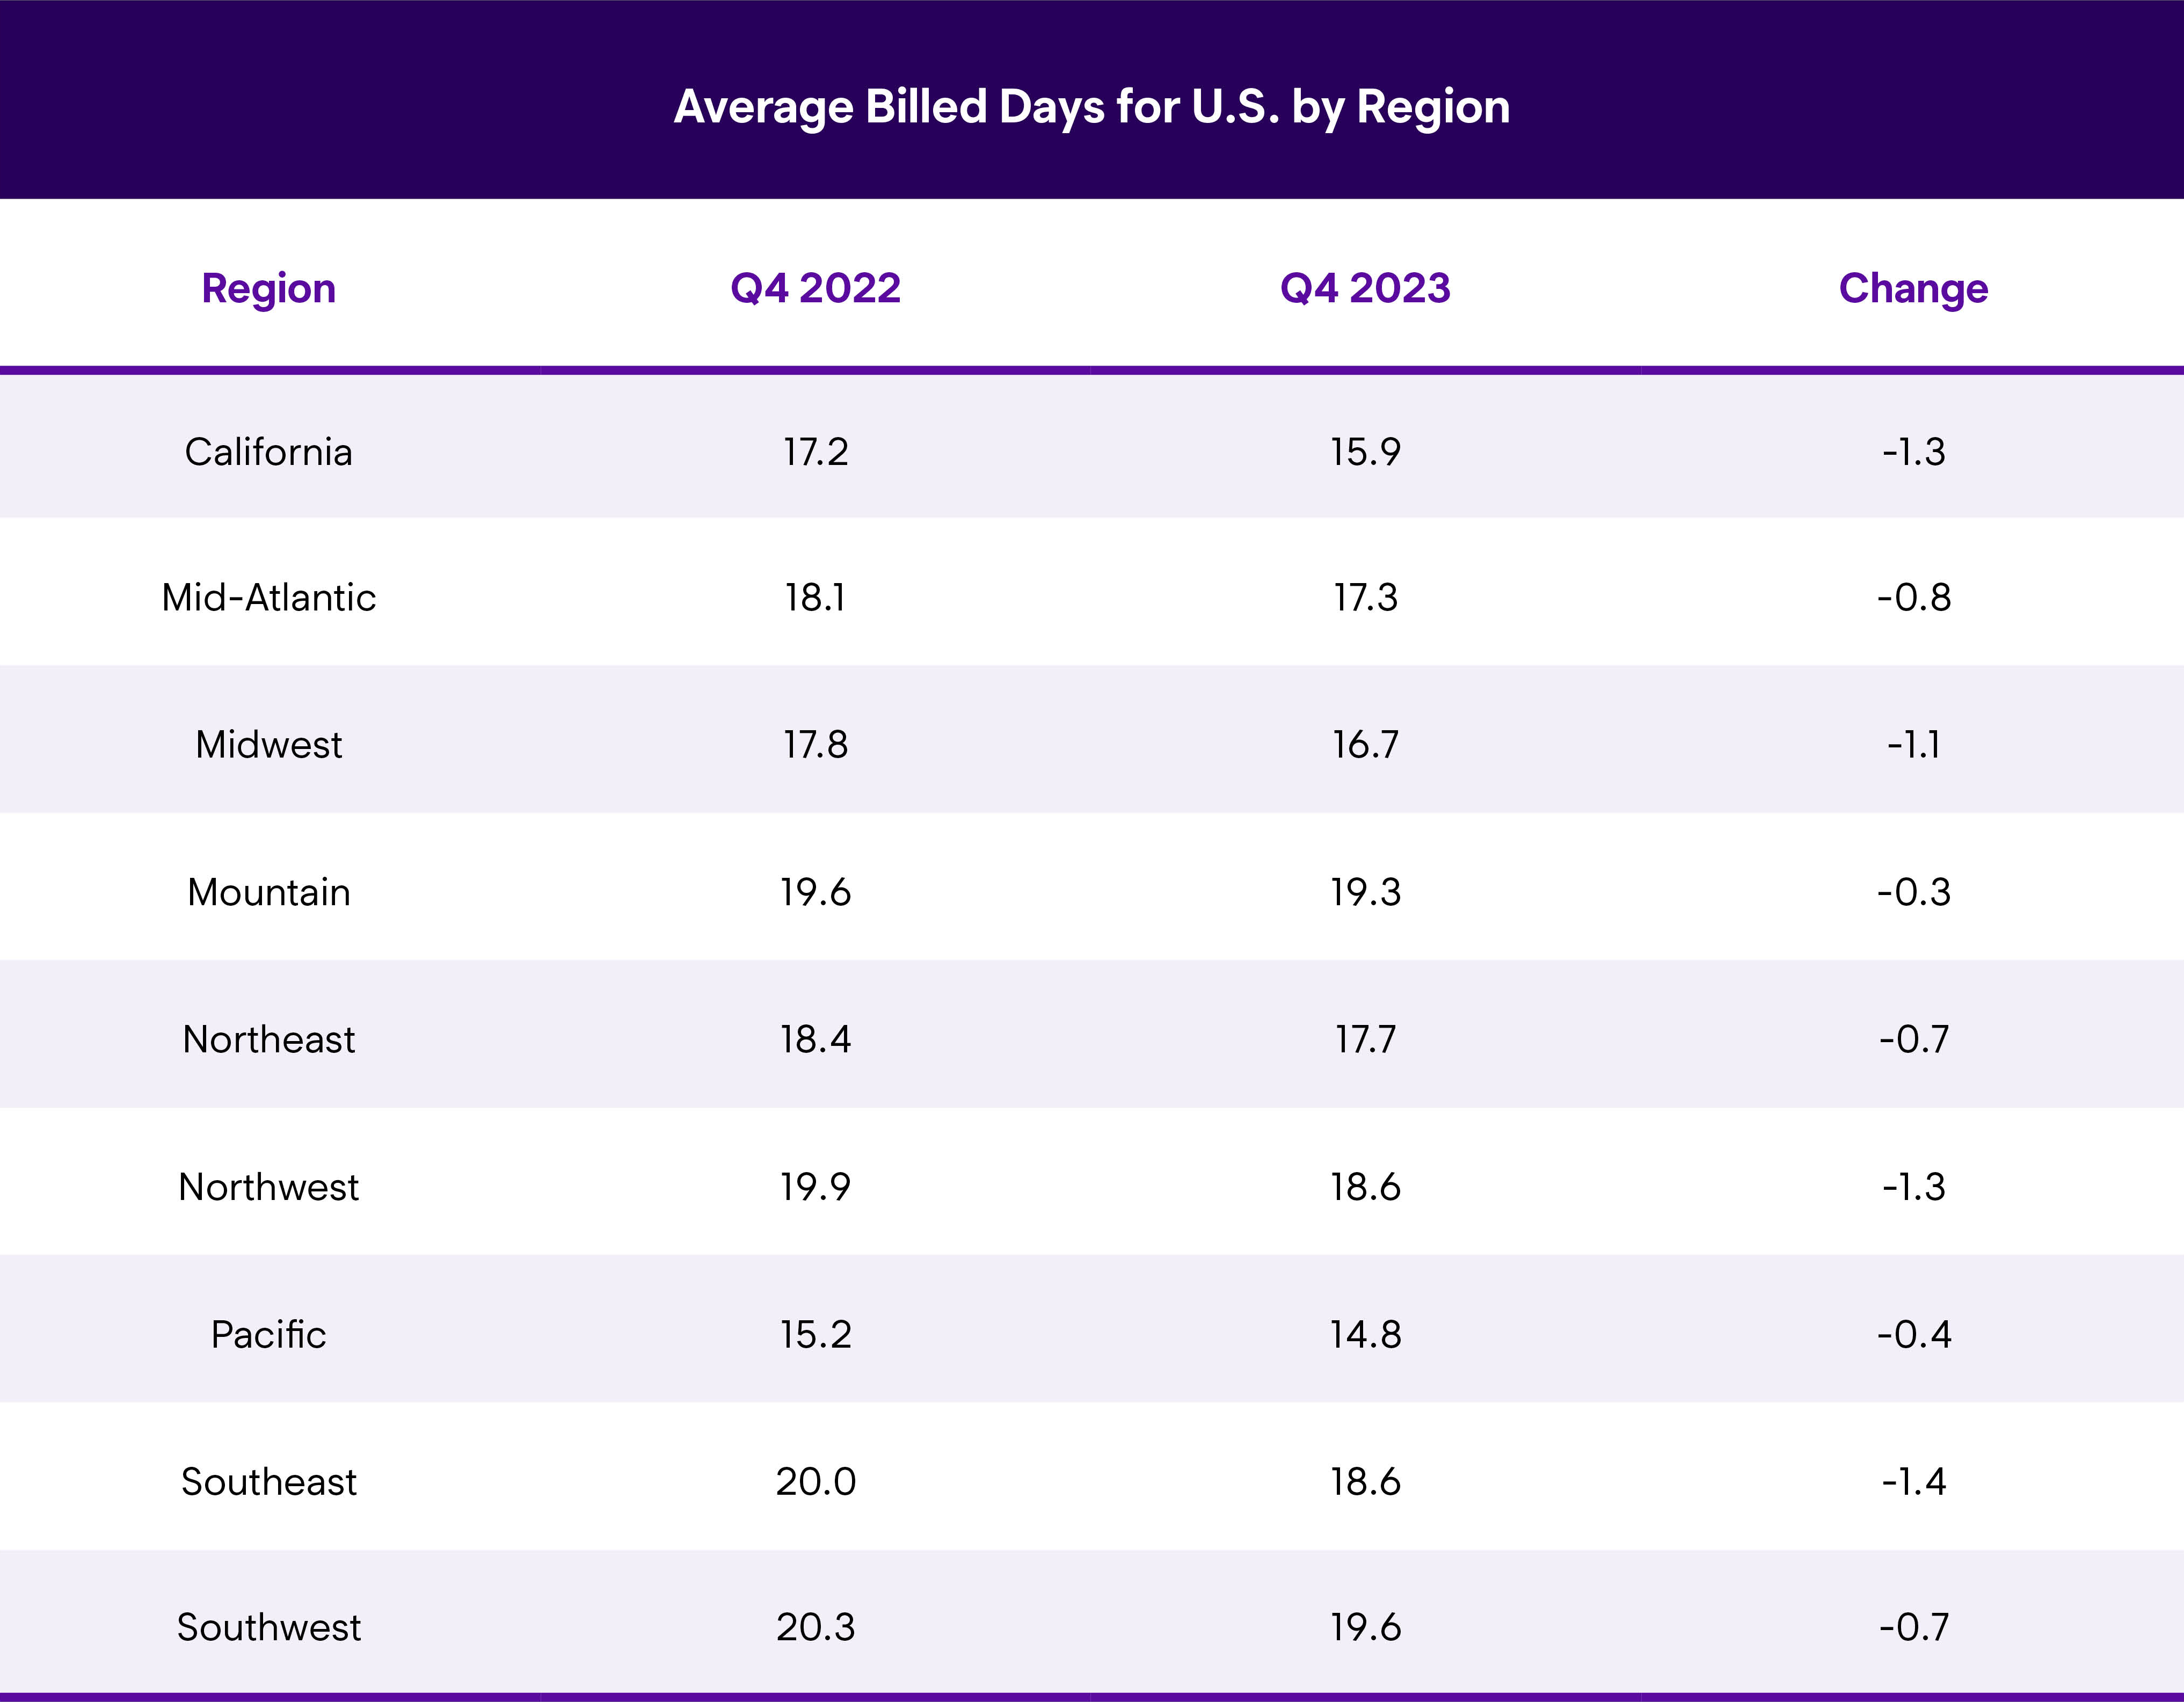
U.S. Average Length of Rental (LOR) By Region—Q4 2023
Overall
Colorado had the highest LOR at 20.9 days, a 0.3-day increase from Q4 2022. West Virginia, Oklahoma, Rhode Island, New Mexico and Kentucky were the next highest, respectively, all with an LOR of 20 days or higher.
Hawaii had the lowest LOR at 13.1 days, followed closely by North Dakota at 13.3 days. Iowa, Nebraska and Washington D.C. had LOR under 15 days, with five other states (Vermont, Wisconsin, Maine, Illinois and California) all coming in with an LOR under 16 days.
Only three states saw year-over-year LOR increases from Q4 2022: Wyoming, Colorado and New Mexico. Of these, Wyoming had the highest increase, up 0.6 days. For the last few years, Louisiana’s overall LOR was often the highest in the nation. While Louisiana’s LOR is still in the top 10 overall, the state recorded a drop of 2.7 days, which is the largest decline in LOR in the country. Nebraska had the next-largest drop, two full days lower than Q4 2022. Nineteen states saw a drop of greater than one day, while 20 more had declines of greater than half a day.
John Yoswick, editor of the weekly CRASH Network newsletter, offered some insights on the fourth quarter: “Some decline in LOR in Q4 2023 lines up with some easing we saw in shops’ backlog of work during that period. The national average backlog in October dropped slightly to 4.1 weeks, down from 4.3 weeks in July. After drops the prior two quarters as well, shop backlog by last fall had fallen by a total of 1.7 weeks over nine months and was about 1.1 weeks lower in Q4 than the same period in 2022.”
PartsTrader’s Chief Innovation Officer, Greg Horn, weighed in: “While October delivery times were negatively impacted for the Big 3 because of the UAW strike, the fourth quarter saw median delivery days lower than the same quarter last year. This is congruent with the overall LOR reduction that Enterprise is seeing.”
Yoswick added: “In other good news for the industry, shops continue to have fewer jobs in-process within their shops, reducing production challenges. We measure work-in-process as the number of jobs (car count) a shop has in-progress compared to that shop’s typical monthly job count. More than 300 shops shared that in Q4 2023 they had work-in-process that, on average, was equal to 68% of their typical monthly volume. That was up 4 points from the prior quarter, but still 10 percentage points lower than a year earlier. It will be interesting in the coming weeks to see what happens with backlog in Q1 2024. Historically, backlog has always risen between October and January. But if the overall trend of declining backlog continues—or if any increase is smaller than typical in past years—that may suggest that the multi-year logjam at shops is really starting to clear, and LOR will likely fall further. We’ll know more in February.”
Drivable
For rentals associated with drivable claims, LOR was 16.0 in the fourth quarter, down 0.2 days from Q4 2022. Colorado had the highest drivable LOR at 19.2 days, followed by Rhode Island at 19.0 days and Oklahoma at 18.9 days. North Dakota had the lowest LOR at 10.8 days, just above Hawaii at 11.6 days—the only two states under 12.0 days. Iowa, Vermont and Nebraska all had LOR lower than 13 days.
Colorado also had the highest increase, up 1.5 days, followed by Wyoming (+1.3) and New Mexico (+1.2). Only 13 other states, plus D.C., had LOR increases. On the other end of the spectrum, Nebraska saw a decrease of 1.5 days, followed by Louisiana (-1.3) and Montana (-1.2). Eight additional states had decreases greater than one-half day, with Wisconsin, California and Florida down 0.9 days each.
Non-Drivable
Non-drivable LOR in Q4 2023 was 24.7 days, a 2.4-day drop from Q4 2022. This is a significant reduction, as Q4 2022’s LOR of 27.1 days was an equally significant rise (+2.8) from Q4 2021, when non-drivable LOR was 24.3 days.
West Virginia had the highest non-drivable LOR at 32.1 days, which was a 0.6-day increase over Q4 2022. New Mexico followed at 29.9 days, with Colorado (29.7) and Washington (29.4) just behind. Iowa had the lowest non-drivable LOR at 21.2 days, just under Nebraska at 21.3 days. New York (21.8) and Virginia (21.9) were the other states under 22 days.
Vermont also saw LOR go up 0.6 days, with Hawaii seeing an increase of 0.1 days. Every other state, plus D.C., had a year-over-year decrease, with the largest being Louisiana—down a massive 5.5 days from Q4 2022, which follows what we observed in Q3 2023, when Louisiana’s non-drivable LOR declined 5.1 days. South Dakota (-4.3) and Arizona (-4.0) had the next-largest decreases.
In Q4 2022, we found that 10 states had a nondrivable LOR greater than 30 days. There were another eight states with LOR greater than 29 days. These results were significant for those first-party customers with Rental Reimbursement policies, as the majority of those policies only allow 30 days’ coverage. In this quarter, only West Virginia is averaging more than 30 days, with New Mexico, Colorado and Washington above 29 days.
Yoswick offered: “Shops also may be processing more work more quickly as they gain the ability to do more ADAS calibration and related work in ways other than subletting it to new-car dealers, who also are often swamped with work. The quarterly “Who Pays for What?” surveys we conduct with Mike Anderson of Collision Advice offer evidence of this change over time. In 2019, the surveys found that about 1 in 3 shops were sending virtually all of their calibration work to dealers; this past fall, just 12% of shops said they were still doing that. Third-party ADAS vendors have doubled their market share in that time, performing an estimated 40% of calibration work compared to 19% five years ago. The percentage of calibration work conducted in-house at shops also has increased from an estimated 24% in 2019 to 32% today.”
Total Loss
LOR associated with Total Loss claims was 16.3 days in Q4 2023, a 1.9-day drop from Q4 2022. Total loss LOR in Q4 2021 was 17.6 days, so the current results are the lowest we’ve seen since before the pandemic.
Vermont had the highest Total Loss LOR at 20.2 days, with Wyoming, West Virginia, New Hampshire, Maine and Washington all 19 days or higher. Florida, Missouri and North Dakota tied for the lowest Total Loss LOR at 14.7 days each.
Only six states (Vermont, Wyoming, Alaska, Maine, Oklahoma and Wisconsin) had Total Loss LOR increases in Q4 2023. All other states, plus D.C., saw decreases, with Hawaii’s (-7.1 days) decrease almost double that of the next-highest decreases in Tennessee and Oregon (both -3.8 days).
Summary
As the numbers show, the trend of ‘predictable’ seasonal LOR continues; the LOR decrease is positive, and many repairers are finding ways to anticipate and operate in the new normal. However, challenging market conditions remain, and overall LOR remains significantly higher than it was pre-pandemic.
Horn added: “We see a slight decrease in the average number of parts ordered per repair as a result of a mild 4th quarter winter compared to last year’s early and heavier winter. Parts are still a major factor in length of rental, but the decreases appear to be a result of a milder winter. Now that we are seeing significant weather in Q1 2024, we can expect a corresponding increase in non-drives with increased number of parts per repair.”
Yoswick also noted: “Other improvements may have been offset to some degree by continued parts challenges in Q4 2023. In late 2022, a CRASH Network survey found that only about 1 in 4 shops said they were seeing more parts challenges than they had a year earlier—and 40% said they were seeing at least some improvement in parts availability. But last month (December 2023), it was just the opposite. About 42% of the more than 300 responding shops were seeing increased parts issues—including almost 1 in 5 who said they were experiencing ‘significantly more’ parts challenges compared to late 2022.”
Canada Length of Rental—Q4 2023
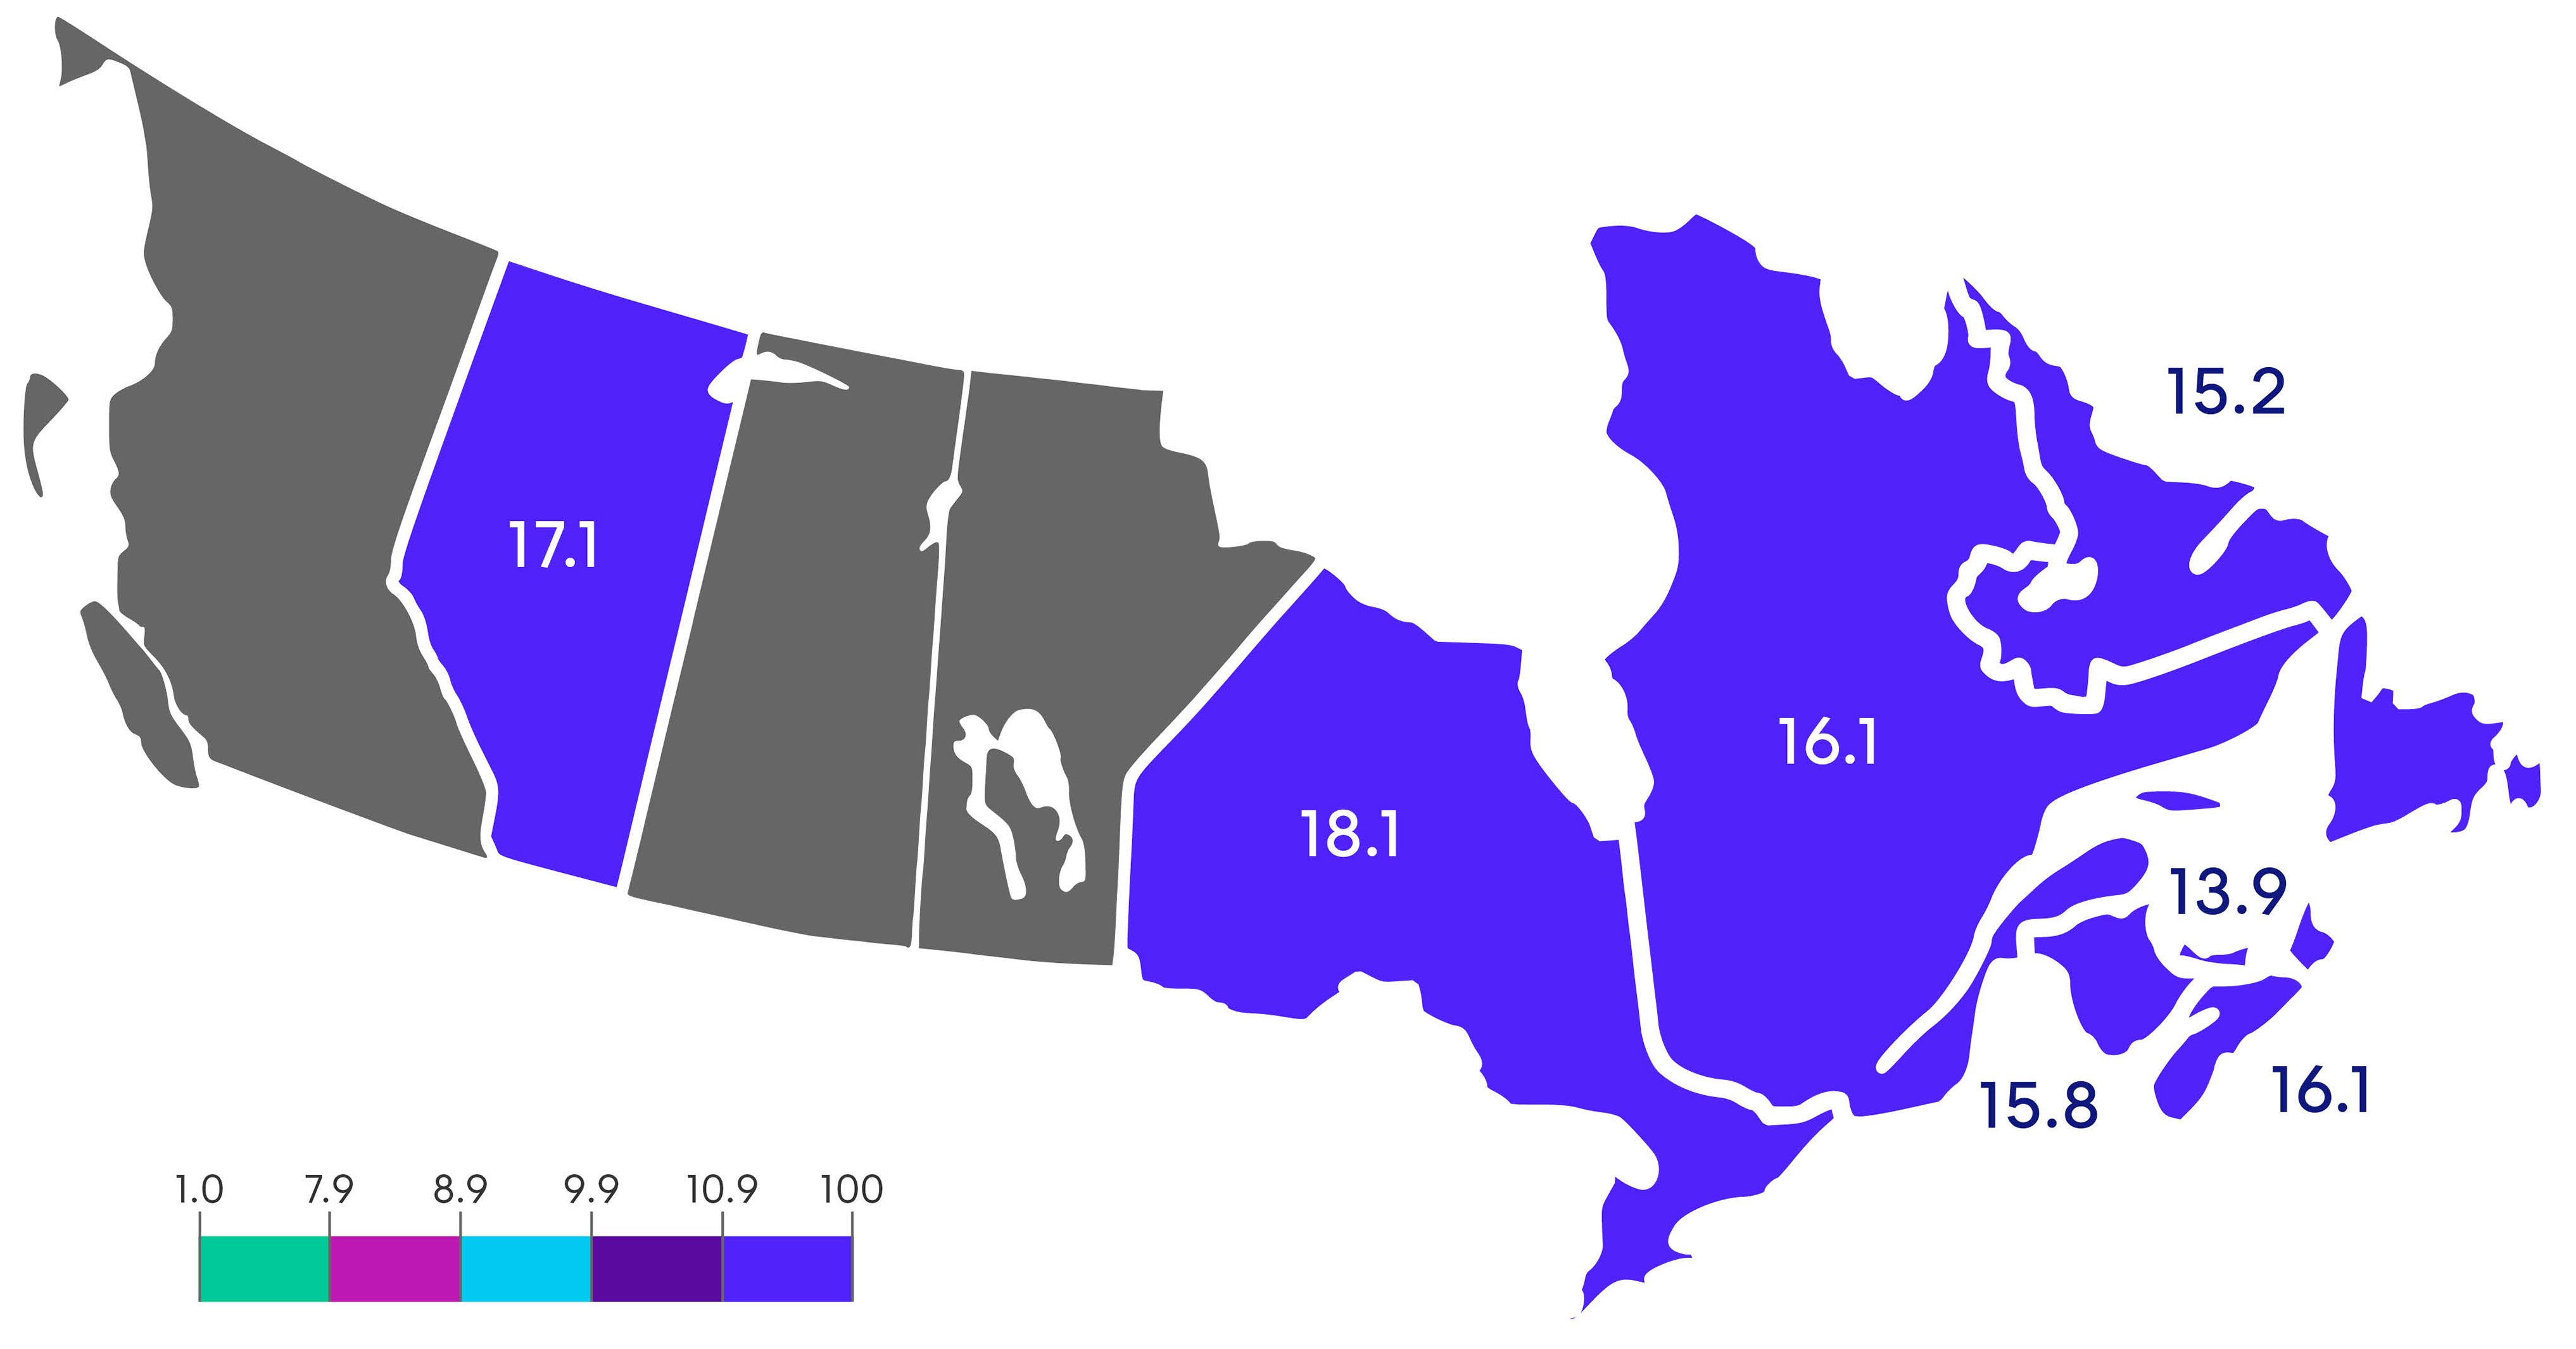
Canada Average Length of Rental (LOR) By Province—Q4 2023
Overall
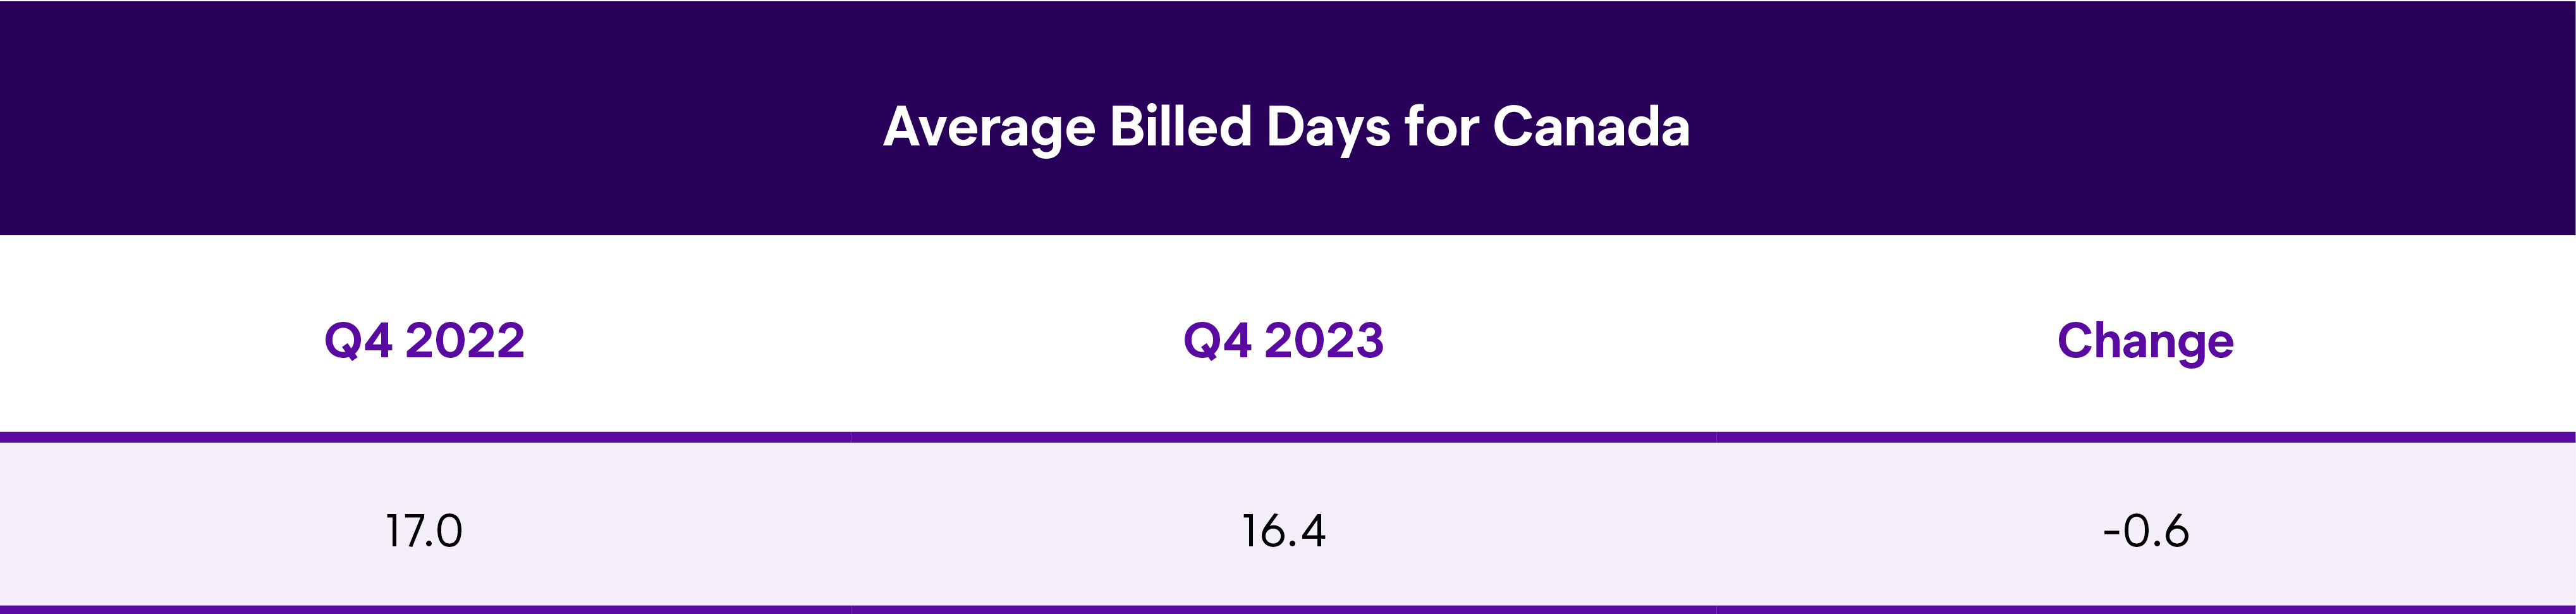
In Q4 2023, overall length of rental (LOR) for collision-related rentals in Canada was 16.4, a 0.6-day drop from Q4 2022. While this drop is not negligible, it still represents a significantly higher Q4 LOR. For comparison, Q4 2021 LOR was 12.8 days, while Q4 2020 LOR was 11.8 days.
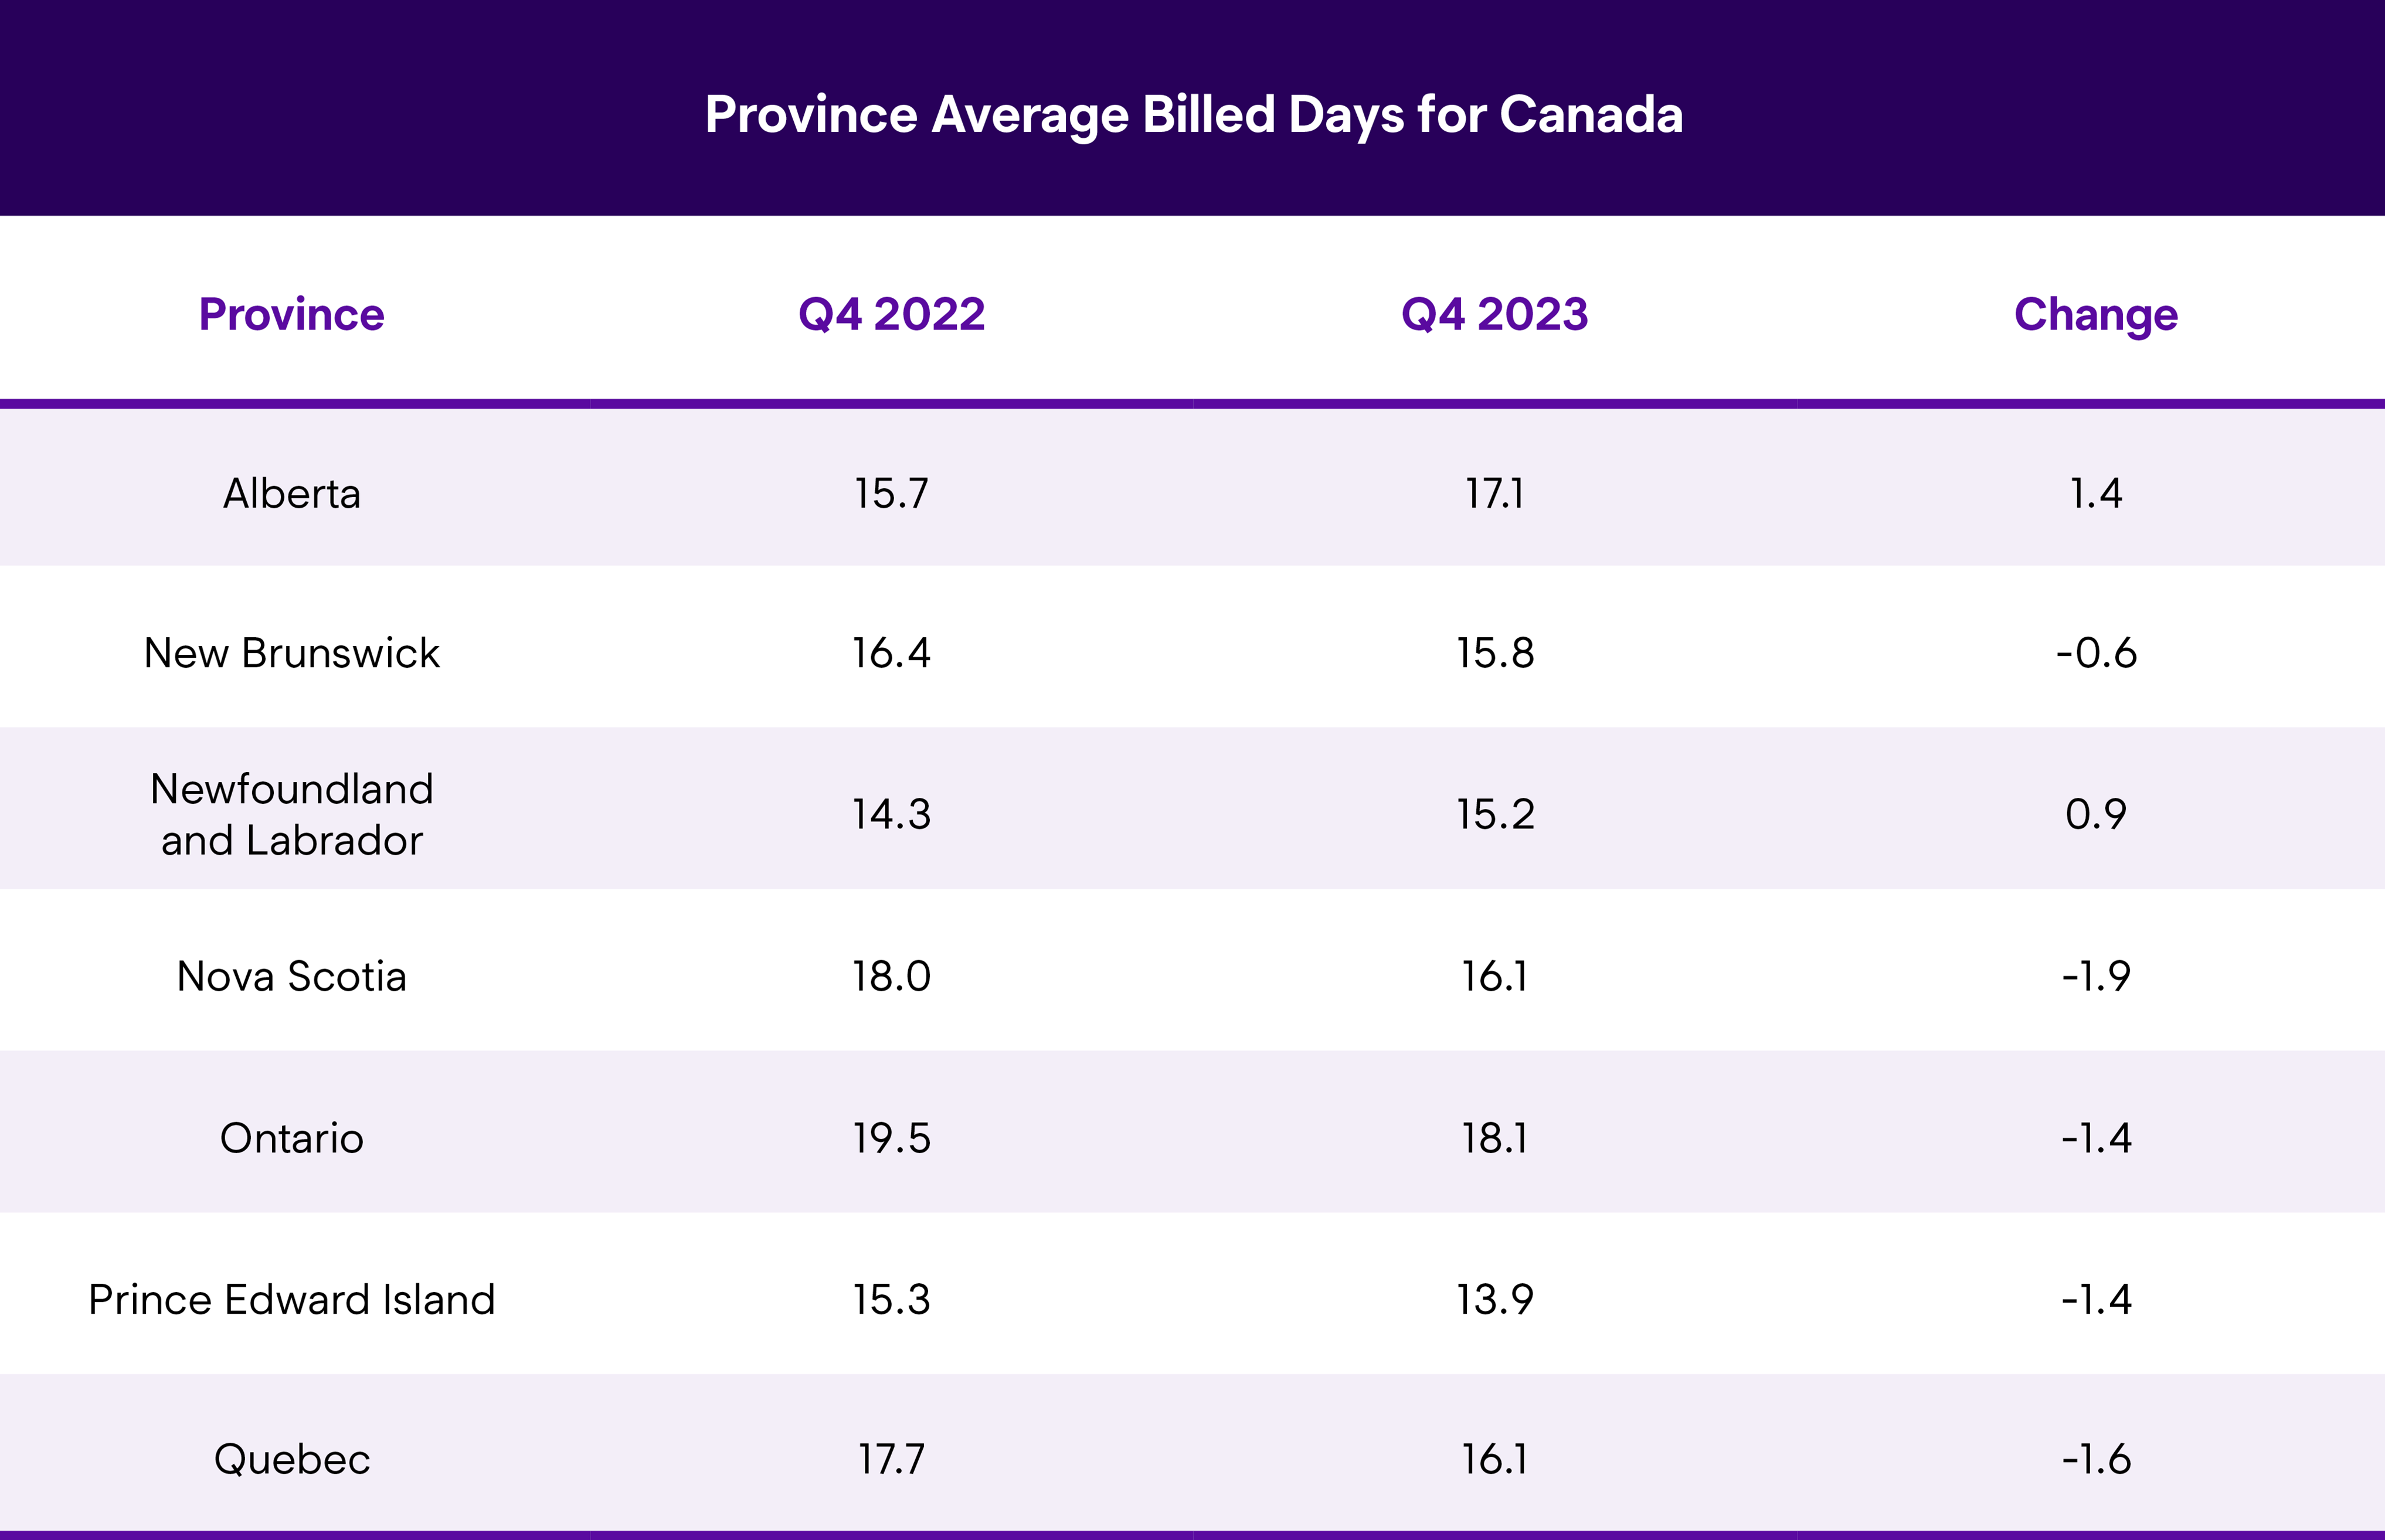
Ontario had the highest LOR at 18.1 days, followed by Alberta at 17.1 days. Prince Edward Island (PEI) had the lowest LOR at 13.9 days. Although nationally the highest, Ontario’s LOR dropped 1.4 days compared to Q4 2022, a drop also shared with PEI. Nova Scotia had the highest decline, down 1.9 days, followed by Quebec with a 1.6-day decline.
We thought it would be of benefit to share some thoughts from the U.S., which has experienced similar challenges to Canada. John Yoswick, editor of the weekly CRASH Network newsletter, offered some insights on the fourth quarter: “Some decline in LOR in Q4 2023 lines up with some easing we saw in shops’ backlog of work during that period. The national average backlog in October dropped slightly to 4.1 weeks, down from 4.3 weeks in July. After drops the prior two quarters as well, shop backlog by last fall had fallen by a total of 1.7 weeks over nine months and was about 1.1 weeks lower in Q4 than the same period in 2022.”
Yoswick added: “In other good news for the industry, shops continue to have fewer jobs in-process within their shops, reducing production challenges. We measure work-in-process as the number of jobs (car count) a shop has in progress compared to that shop’s typical monthly job count. More than 300 shops shared that in Q4 2023 they had work-in process that, on average, was equal to 68% of their typical monthly volume. That was up 4 points from the prior quarter, but still 10 percentage points lower than a year earlier. It will be interesting in the coming weeks to see what happens with backlog in Q1 2024. Historically, backlog has always risen between October and January. But if the overall trend of declining backlog continues—or if any increase is smaller than typical in past years—that may suggest that the multi-year logjam at shops is really starting to clear, and LOR will likely fall further. We’ll know more in February.”
From a parts perspective, Ryan Mandell, Director of Claims Performance for Mitchell International, shared: “In Canada, alternative parts utilization (APU) percentage rose to 27.7%, up from 24.8% in Q4 2022, which is a trend we are watching across North America. As aftermarket delivery times are typically under 24 hours, this has an impact on the parts procurement cycle time. We are also seeing a greater frequency of repair operations than in Q4 2022 (24.6% compared to 23.0%), suggesting that potentially when parts are not available, shops are more likely to repair the part than wait for an extended period of time for a replacement to become available.”
Drivable
Drivable LOR was 12.6 days in Q4 2023, a slight increase (+0.2) from Q4 2022. Ontario had the highest drivable LOR overall at 14.0 days, but that was a half-day drop from Q4 2022. Alberta was close behind at 13.9 days, but these results represented a 1.8-day increase. Quebec had the lowest drivable LOR at 9.9 days, which was also 0.5 days lower than Q4 2022.
Non-Drivable
Non-drivable LOR across Canada was 30.9 days, exactly the same as it was in Q4 2022. Ontario was tops again at 33.8 days, a 0.4-day decrease from Q4 2022. Alberta was next-highest at 31.7 days, which conversely was a 2.8-day increase. Quebec had the lowest non-drivable LOR at 23.5 days, a 1.3-day drop from Q4 2022. Nova Scotia had the largest decline in LOR, dropping 1.5 days.
Total Loss
For rentals associated with total losses, LOR was 23.6 days, a 1.8-day decline from Q4 2022. A large gap exists between top and bottom; PEI recorded the highest LOR at 32.5 days, a 2.7-day increase, while Newfoundland and Labrador had the lowest at 16.7 days, a 1.1-day drop. Ontario (24.0) and Quebec (20.6) saw large declines, at 3.7 days and 4.1 days respectively. Alberta’s LOR (22.9) rose slightly, while Nova Scotia and New Brunswick had significant rises at 4.9 days and 2.9 days, respectively.
Mandell also shared: “Total loss frequency has increased in Canada, going from 19.2% in Q4 2022 to 20.8% in Q4 2023. Canadian used vehicle values are just starting to decline; total loss frequency numbers will remain elevated as long as OEM supply chains remain under pressure, which may worsen in the wake of the UAW strikes, forcing insurers to write off vehicles when replacement parts are not readily available.”
Summary
The LOR results for the fourth quarter demonstrate impacts from supply chain disruptions, parts delays, collision repair backlogs and technician shortages, though the decrease is encouraging. For comparison, the U.S. LOR in Q4 2023 was 17.7 days, 1.3 days higher than Canada. But the U.S. saw a full day decline from Q4 2022, outpacing Canada’s 0.6-day decline.
With the complexity of vehicle repairs only increasing, for both internal combustion engine (ICE) and battery electric vehicles (BEV) models, the entire industry must play a part in ensuring all collision-related businesses are aligned—not just for procedural solutions, but to ensure our mutual customers receive safe and proper repairs, an excellent experience and peace of mind. Enterprise is committed to partnering with insurers, repairers and suppliers on each one of these issues.
Through foundational support provided by the Enterprise Mobility Foundation, Enterprise is spearheading the Collision Engineering Program, designed to attract and develop entry-level talent to fill essential roles within the collision repair industry. Enterprise is thrilled to expand its longtime partnership with Ford Motor Company, through its philanthropic arm, the Ford Fund, to expand the program and help address this ongoing industry challenge. For more information, visit beacollisionengineer.com.