

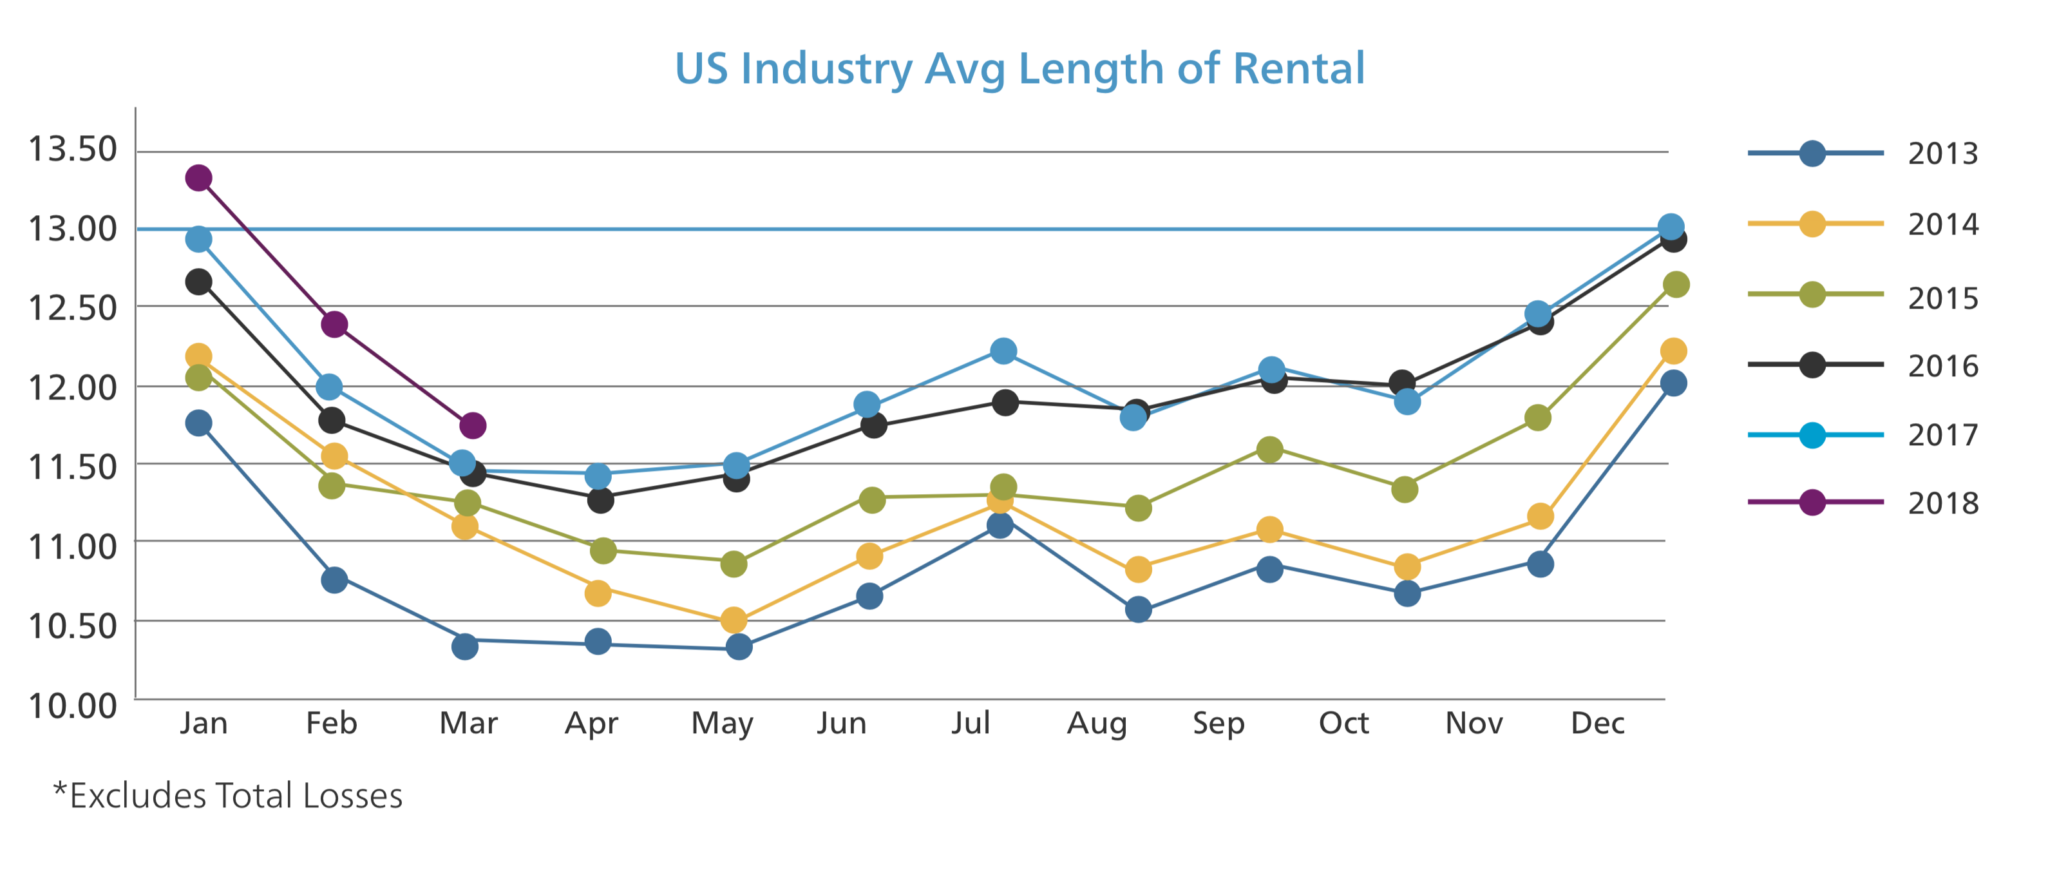
Average Length of Rental for Repairable Vehicles: Q1 2018
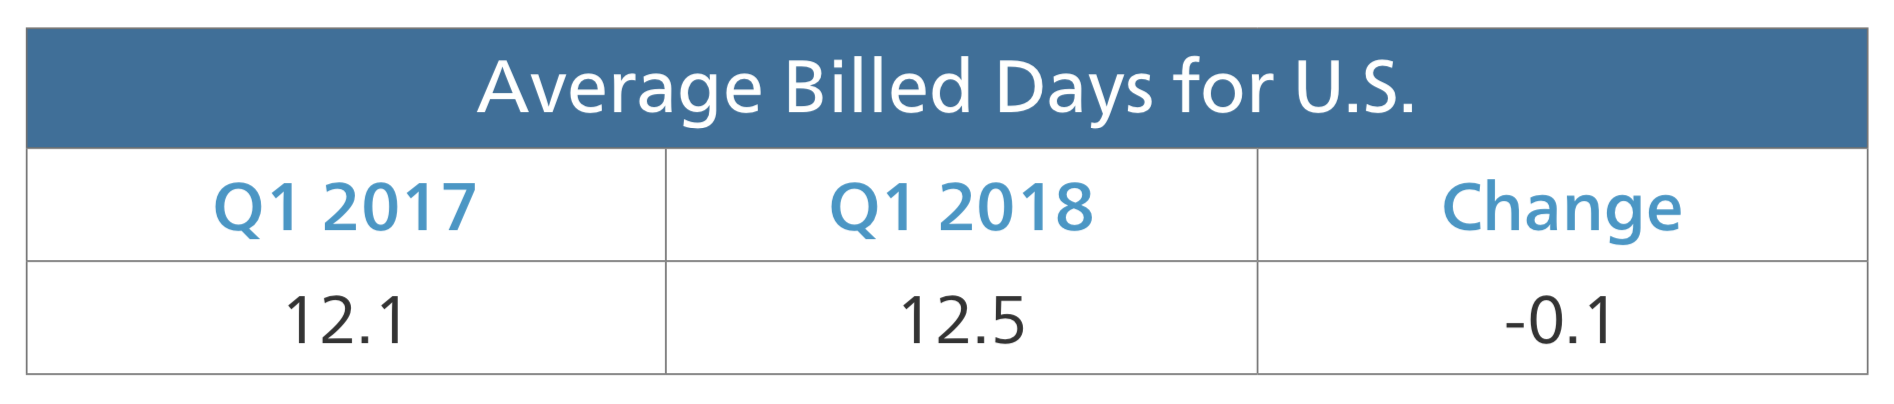
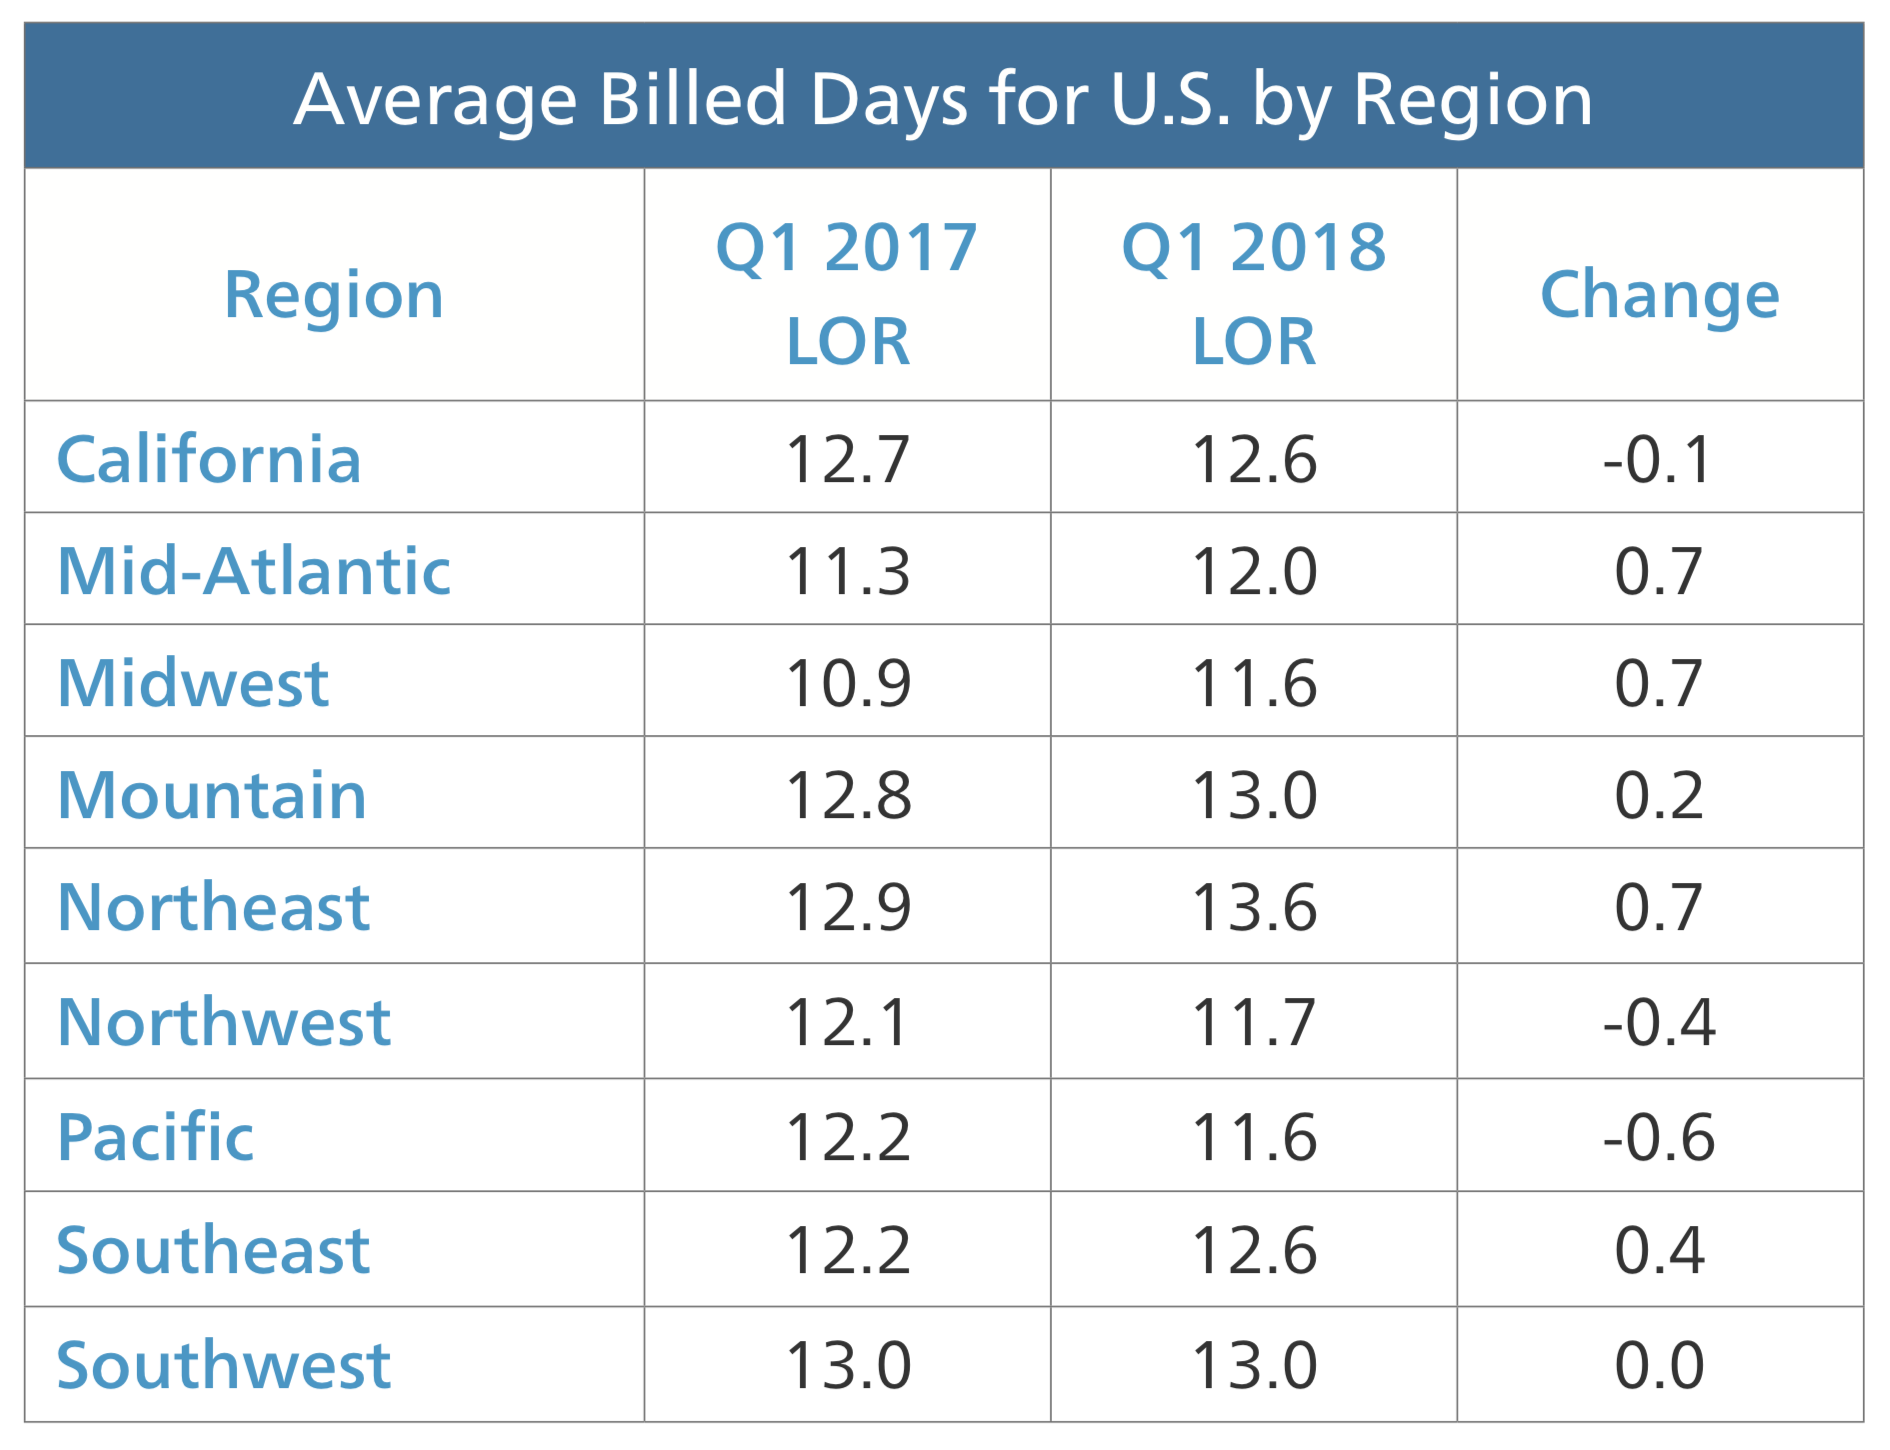
Average Length of Rental for Repairable Vehicles: Q1 2018 Average Length of Rental (LOR) for Q1 2018 landed at 12.5 days in the United States, an increase of .4 days compared to Q1 2017. This represents a return to the consistent upward trends generated throughout 2015 and 2016 after a largely fat 2017 Once again, there was very little consistency between regions and states, suggesting that the quarterly result for the U.S. is not reflective of a genuine national trend. The Northeast, Midwest and Mid-Atlantic regions produced the largest increases at .7 days while the Pacific had the steepest decline at .6 days. The average LOR ranged from a high of 13.6 days in the Northeast to a low of 11.6 in the Pacific and Midwest. At the state level, Puerto Rico and North Dakota were once again the outliers at 18.1 and 9.7 days, respectively. At least 26 states deviated significantly in terms of year-over-year change, further demonstrating a lack of consistency. Puerto Rico (5.1), Michigan (1.3) and Vermont (1.2) produced the largest increases with the Island still being impacted by the devastation of Hurricane Maria. The most significant decreases in LOR included Alaska (-1.8), Oregon (-1.3), Idaho (-.6) and Montana (-.6). Alaska remained .9 days above the U.S. average (12.5) despite the significant drop.
"The average LOR ranged from a high of 13.6 days in the Mountain region to a low of 11.2 in the Pacific."
As pointed out in previous updates, there remains a significant delta between average and best in class. Collision centers that invest in extensive training, consistently execute a robust scheduling strategy, and properly utilize the ARMS® Auto application, routinely outperform market-average LOR metrics.
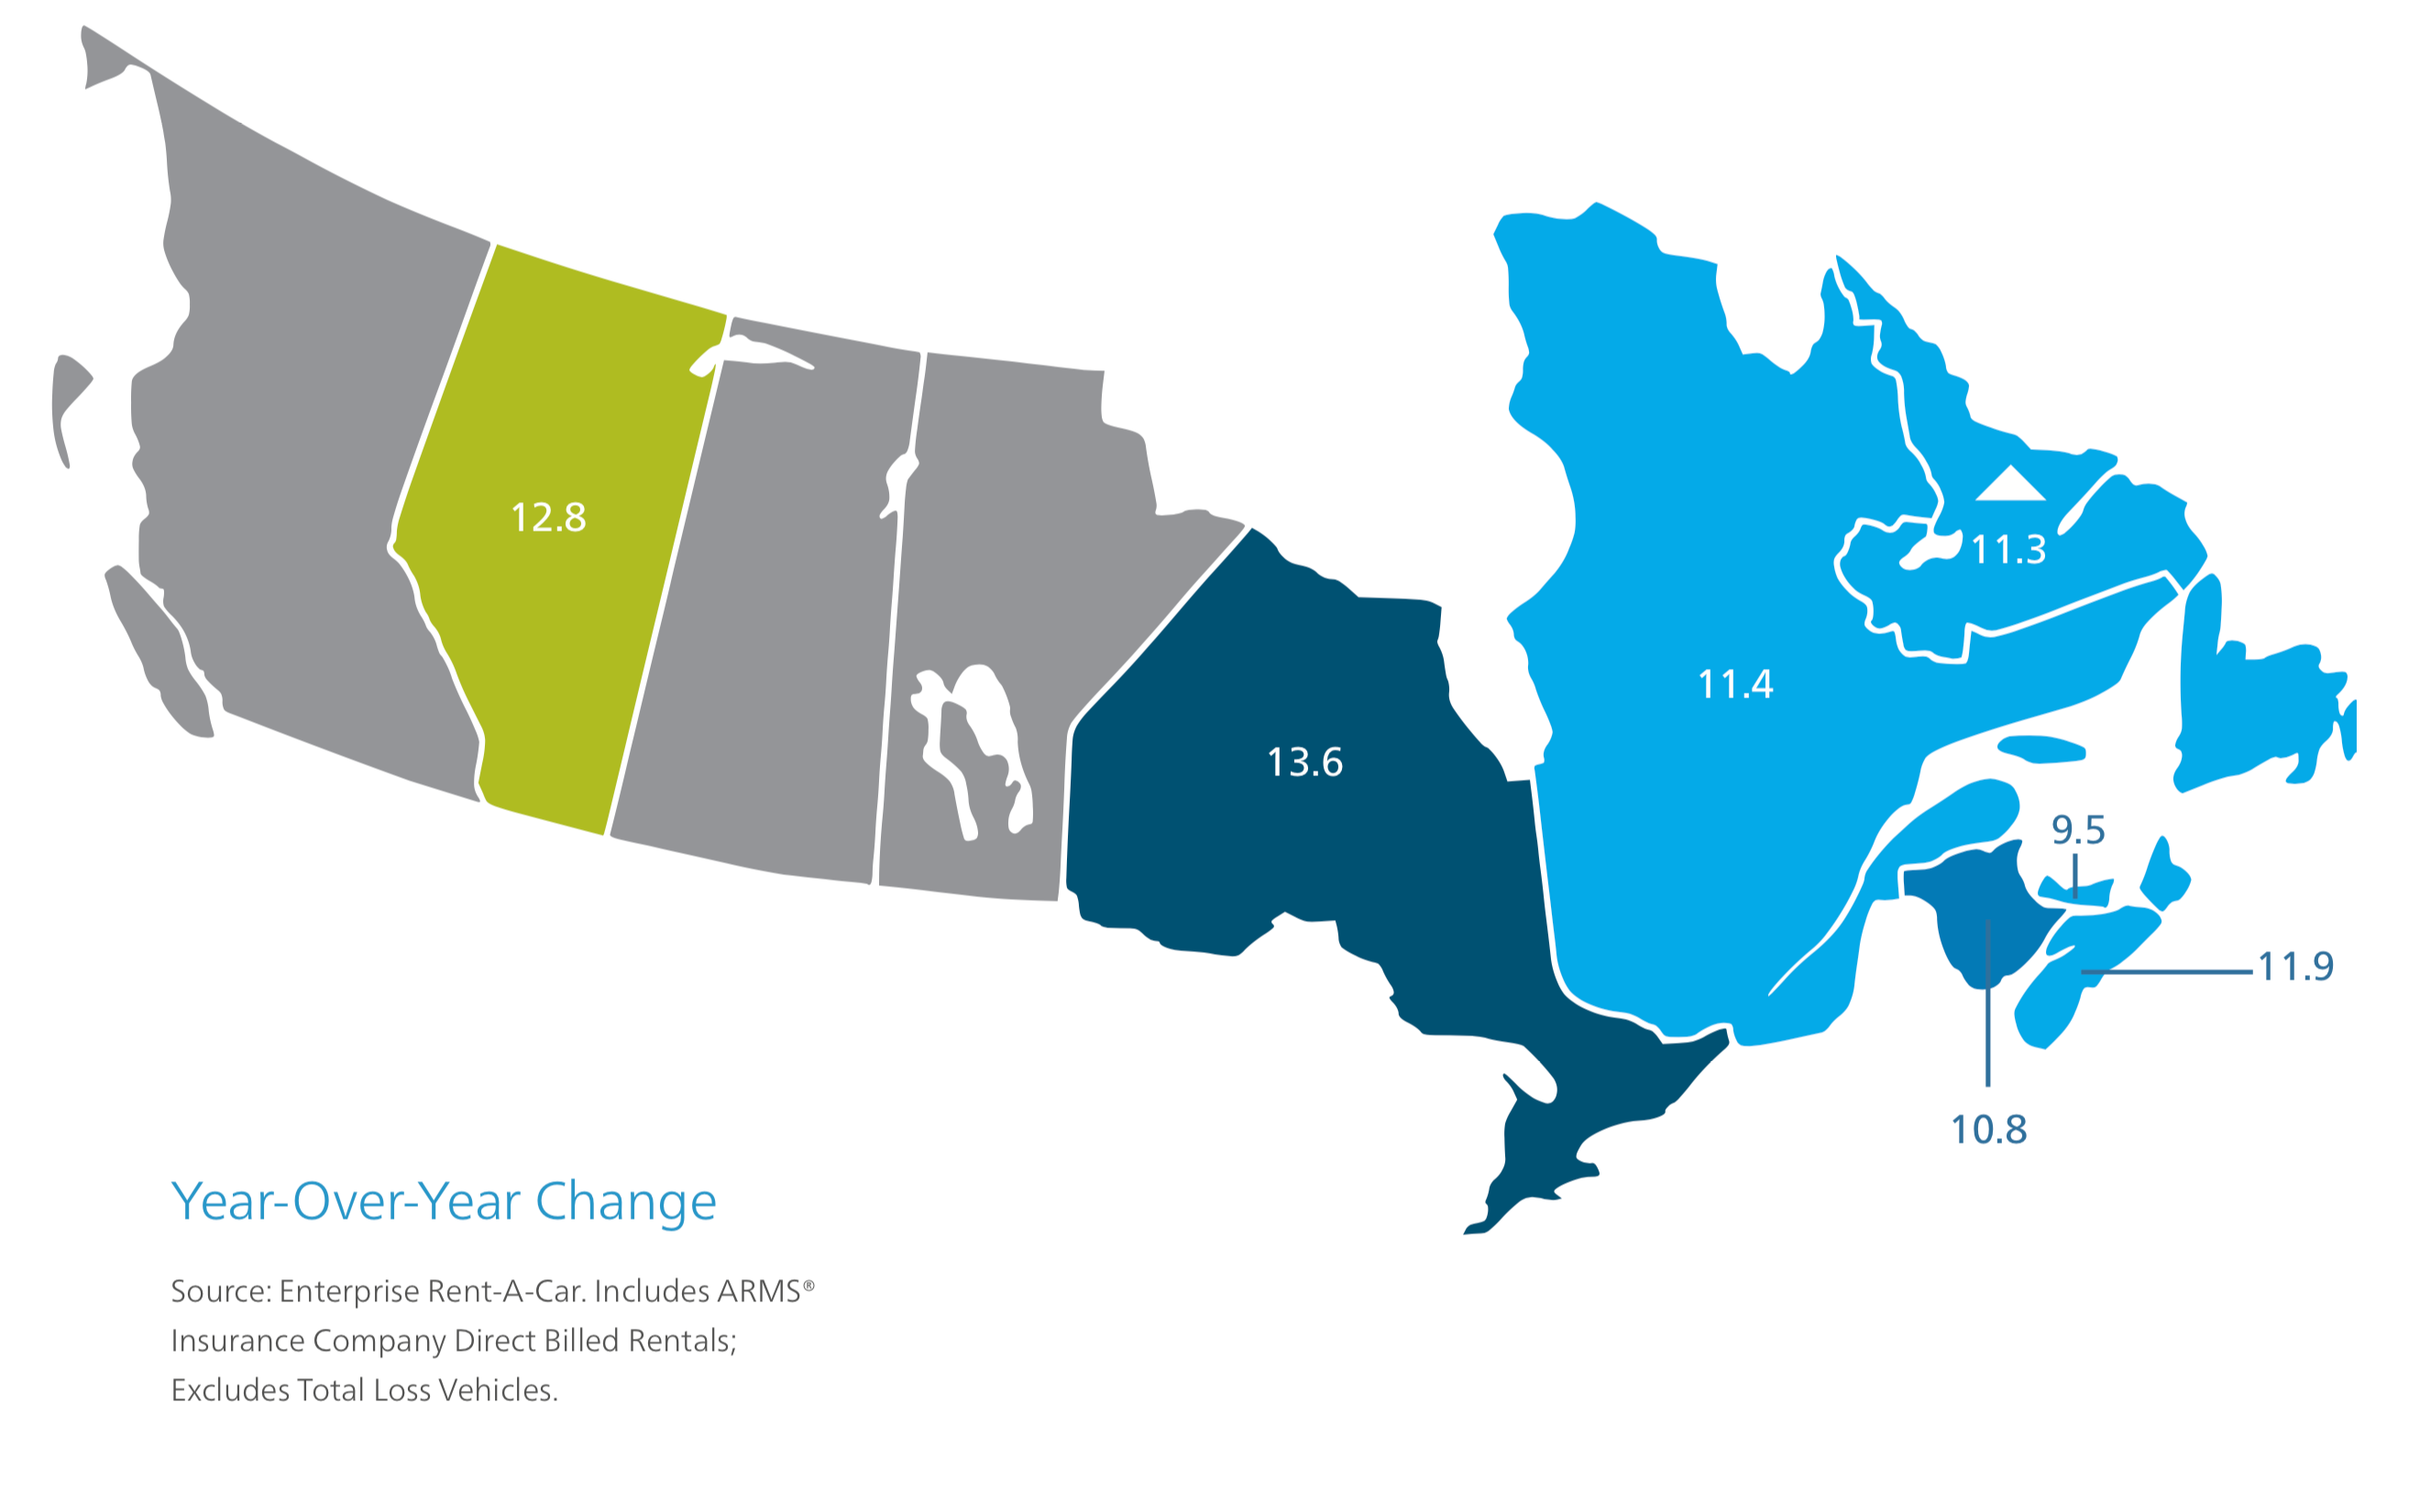
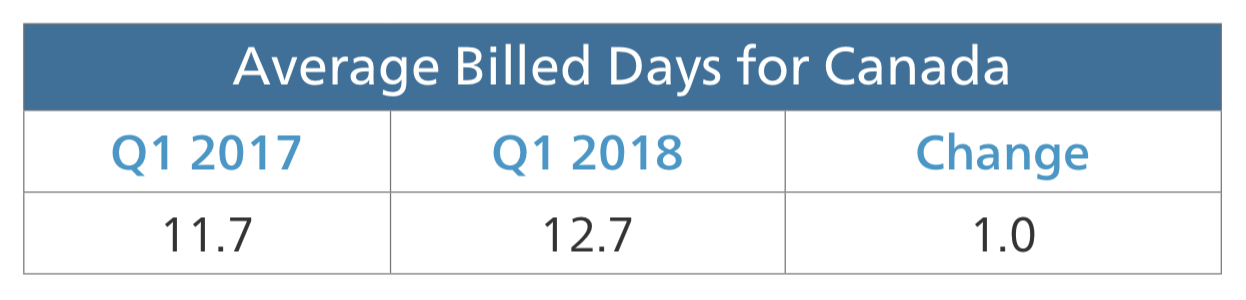
Canadian Length of Rental—Q1 2018
Canada’s Length of Rental (LOR) concluded at 12.7 days for Q1 2018. This was .9 days longer than the Q4 2017 result of 11.8 days, and 1 day longer than the Q1 2017 result of 11.7 days. While the United States also witnessed an LOR increase—.4 days—through the first 90 days of 2018, (from 12.1 days to 12.5 days), January 2018 through March 2018 also marked the first time in more than 2 years where Canada posted a longer LOR result than its southern neighbor. For reference, Canada’s LOR was 1.2 days shorter than the US in Q4 of 2016, and .6 days shorter than the US in Q4 of 2017.
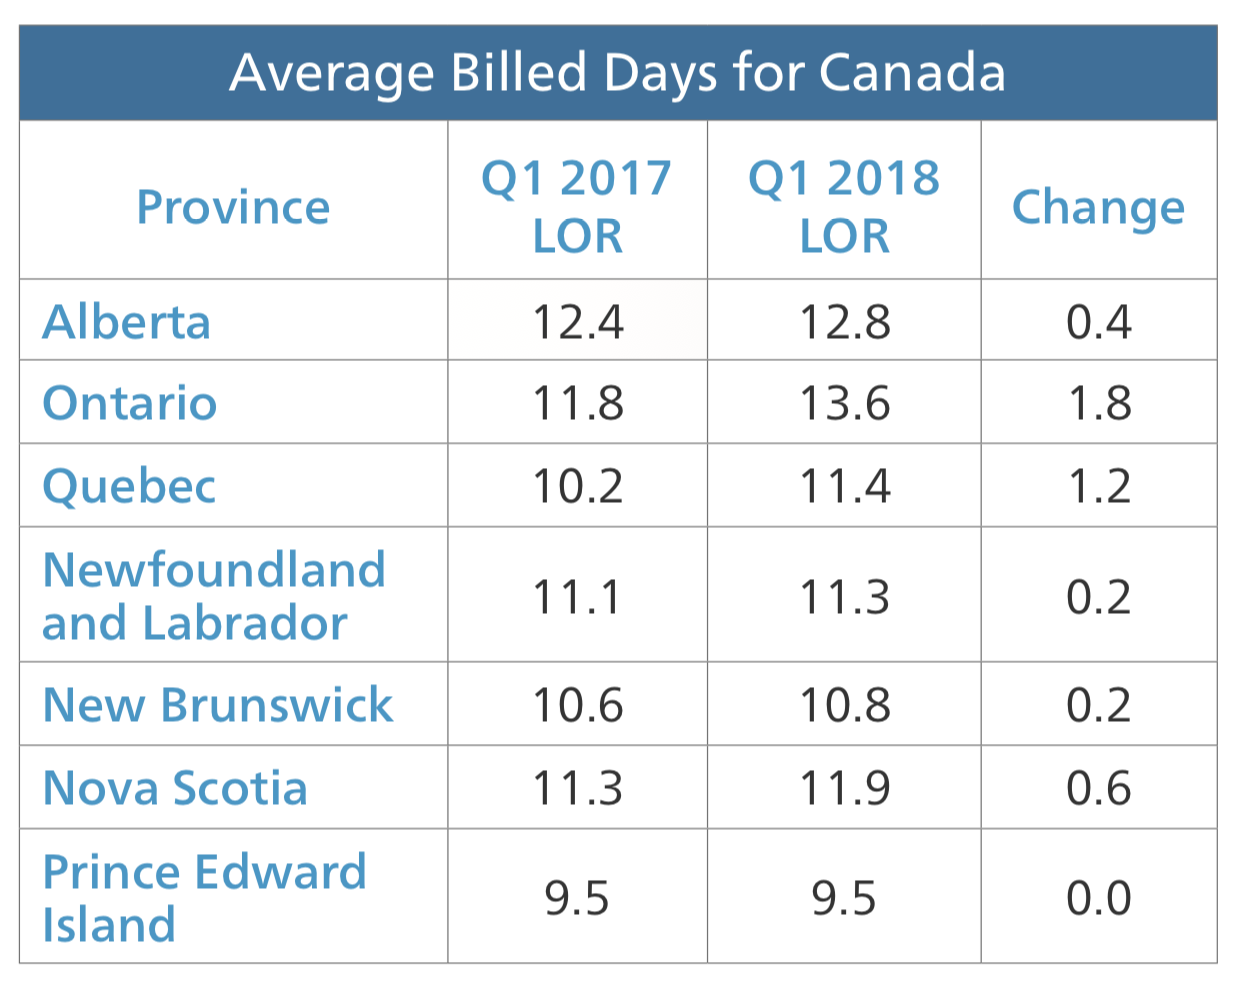
Consistent with past performance, there was a large variance in individual provincial results in Canada for Q1 2018. Prince Edward Island was the sole province that did not see an increase over Q1 2017 (remaining fat at 9.5 days), while six provinces posted an increase over last year, with those increases ranging from .2 to 1.8 days. Ontario and Quebec each added over 1 day to their Q1 result relative to the same time period last year. Overall, Canada’s Q1 LOR ranged from a low of 9.5 days in PEI to a high of 13.6 days in Ontario. Provinces that posted shorter LOR than the national average include Quebec, Newfoundland, New Brunswick, Nova Scotia and PEI. As kilometers driven and complexity of repair increase, we see a trend towards longer LOR. As in the US, there is a significant difference between “Average” and “Best in Class” LOR. Collision Centers that invest in a robust scheduling strategy, extensive training, and proper utilization of the ARMS® Auto application can expect to out-perform market averages for LOR.
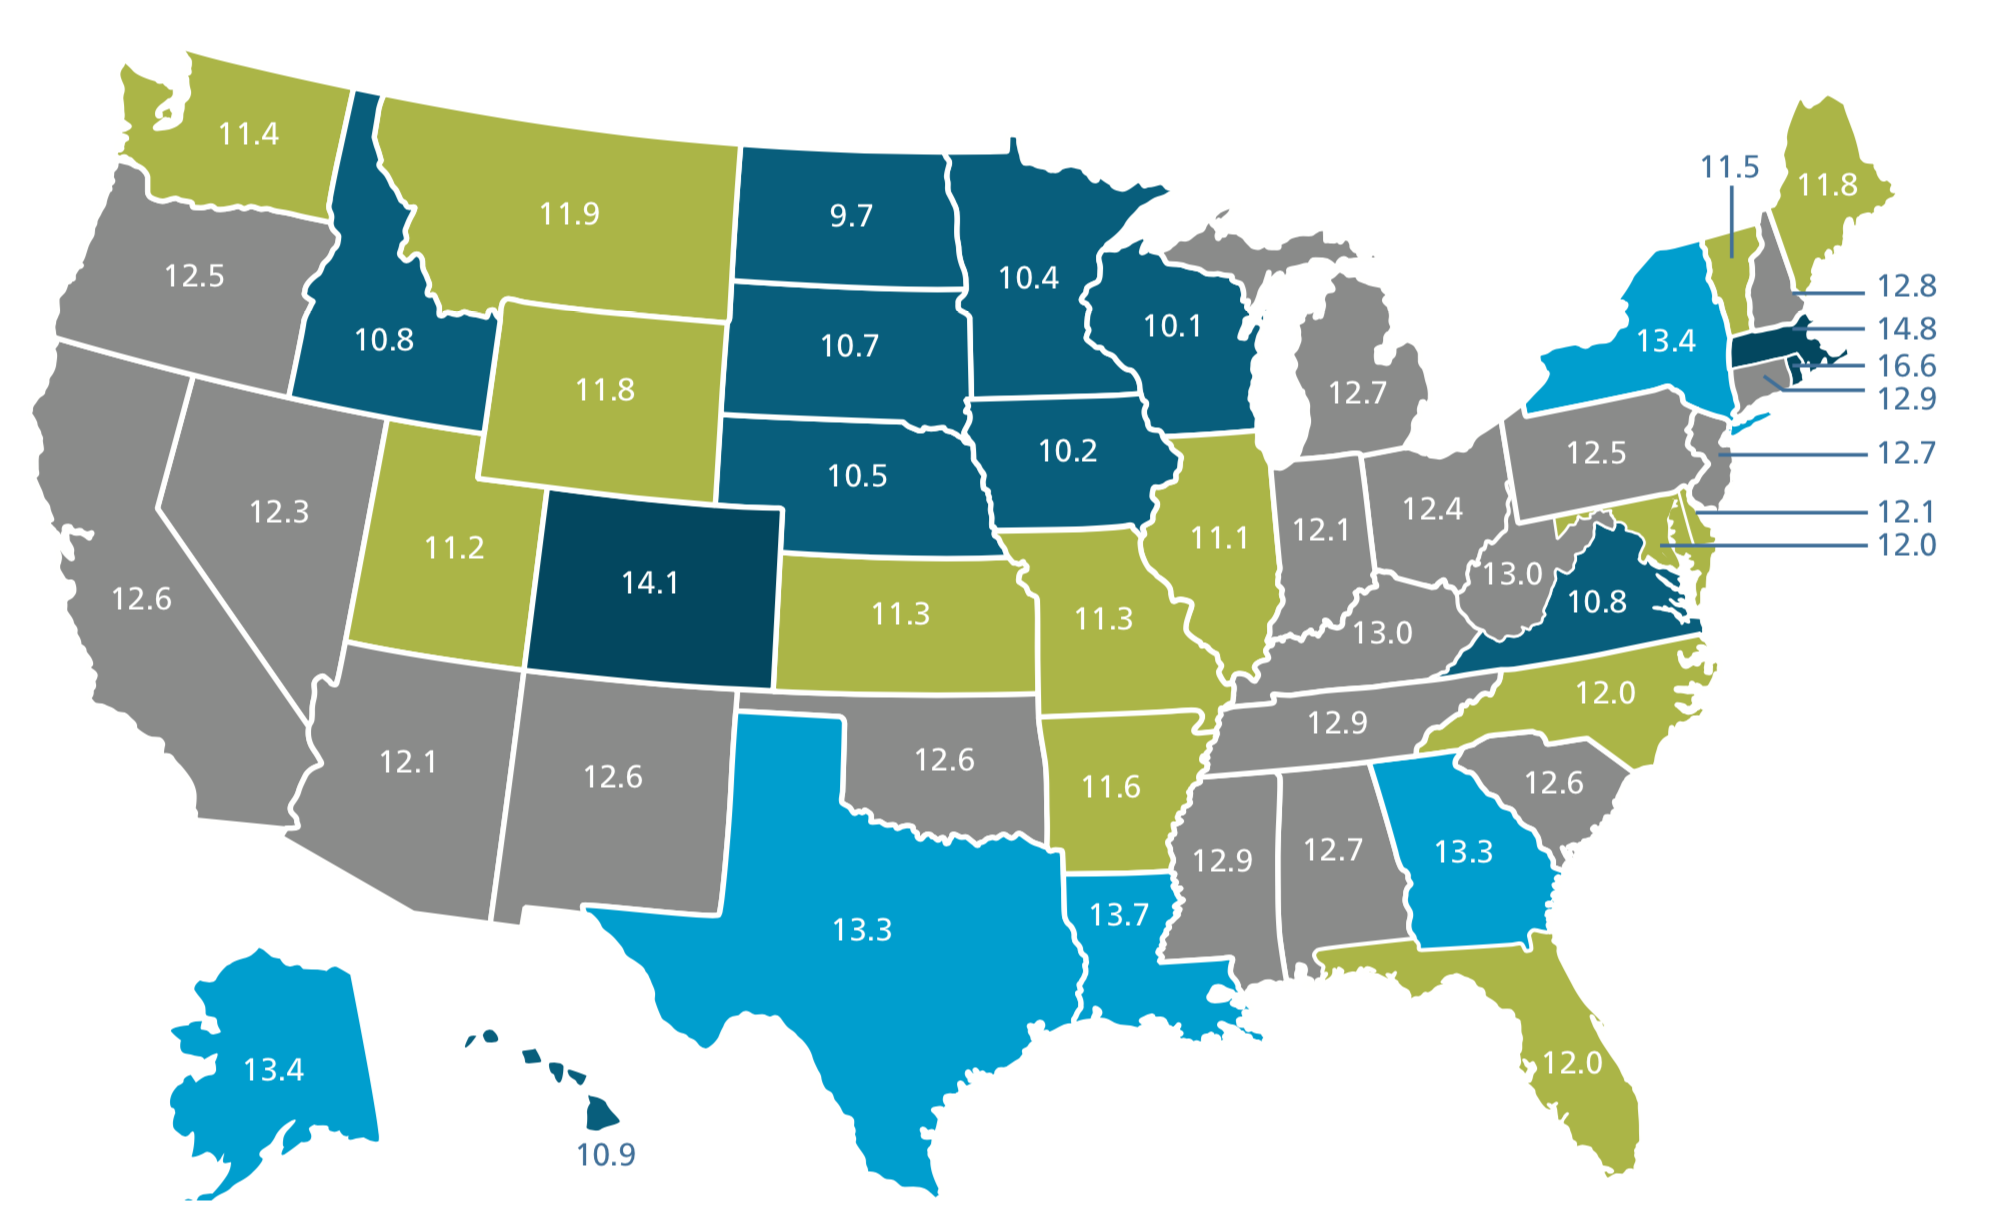
U.S. Average Length of Rental (LOR) by State Q1 2018
Click image to enlarge chart
At least 20 states deviated significantly in terms of year-over- year change, further demonstrating a lack of consistency.
Click image to enlarge chart
Canadian Average Length of Rental by Province Q4 2017
Click image to enlarge chart
Click image to enlarge chart
The quarterly LOR summary is produced by Dan Friedman, Assistant Vice President Collision Industry Relations and Sales at Enterprise Rent-A-Car. Dan has 21 years of experience with Enterprise working within the collision repair industry. Through its ARMS® Automotive Suite of Products, Enterprise provides collision repair facilities with free cycle time reporting with market comparisons, free text/email capability to update their customers on vehicle repair status, and online reservations. More information is available at armsautosuite.com or by contacting Dan Friedman at Daniel.Friedman@ehi.com.